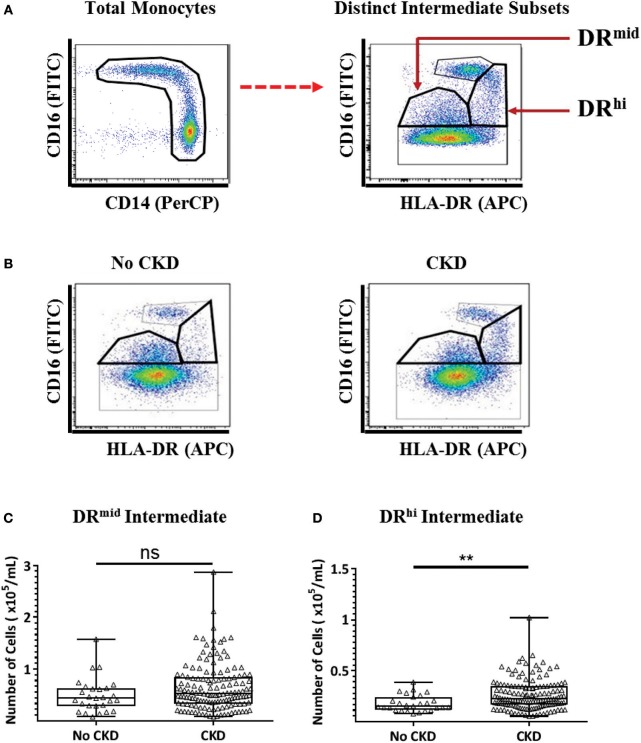
Figure 3.
Multi-color flow cytometry for the identification and quantification of distinct DRmid and DRhi intermediate monocyte subpopulations. (A) Representative example of the gating strategy used for the identification and quantification of two distinct intermediate monocyte subpopulations based on HLA-DR surface expression. (B) Representative examples of flow cytometry dot plots from subjects without (no CKD) and with (CKD) chronic kidney disease showing the distribution of four monocyte subpopulations, (C,D) Graphs are shown of absolute numbers of DRmid (C) and DRhi (D) intermediate monocytes expressed as cells per mL of whole blood for study subjects with No CKD (n = 27) or CKD 1–5 (n = 142). Graphs illustrate the median, IQR, and upper and lower limit for each leukocyte subtype for No CKD and CKD groups (box and whisker plots) with data-points for individual subjects superimposed (triangles) Statistical comparisons performed using Mann-Whitney U-test. ns p > 0.05, **p < 0.01.

