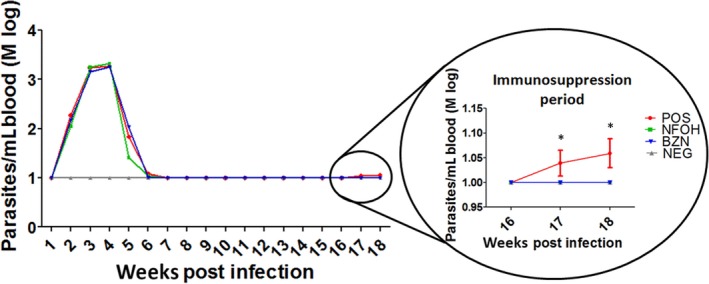
Figure 3.

Trypanosoma cruzi (Y strain) parasitaemia curves from infected isogenic BALB/c mice (POS and NFOH and BZN treatments), expressed as logarithmic mean (Mlog). *Statistically different of NFOH, BZN and NEG groups (P < 0.0001) [Colour figure can be viewed at wileyonlinelibrary.com]
