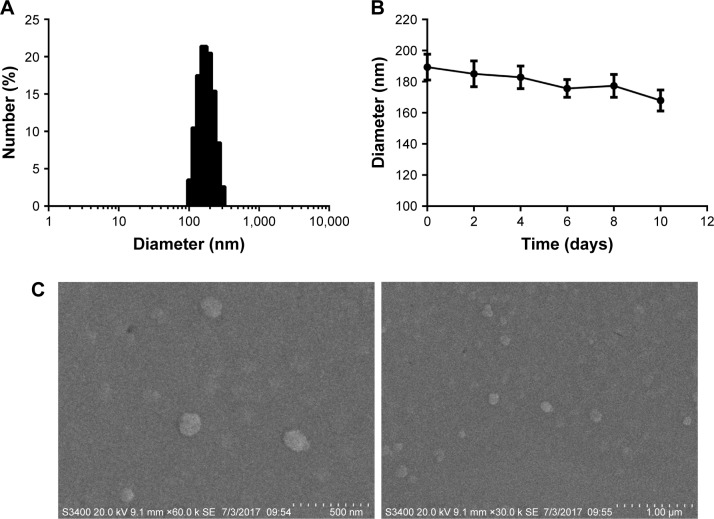
Figure 2.
The structural characterization and surface morphology of the NPs.
Notes: (A) The size distribution of the DOC-PEG-PCL-mAb NPs determined by DLS. (B) Stability of the DOC-PEG-PCL-mAb NPs. The diameter of the NPs was determined by DLS, and each value represents the mean±SD. (C) Representative FESEM images of the DOC-PEG-PCL-mAb NPs. Scale bar represents 500 nm and 1 µm.
Abbreviations: DLS, dynamic light scattering; DOC, docetaxel; FESEM, field emission scanning electron microscopy; mAb, monoclonal antibody; NP, nanoparticle; PEG-PCL, poly (ethylene glycol)-poly (ε-caprolactone).

