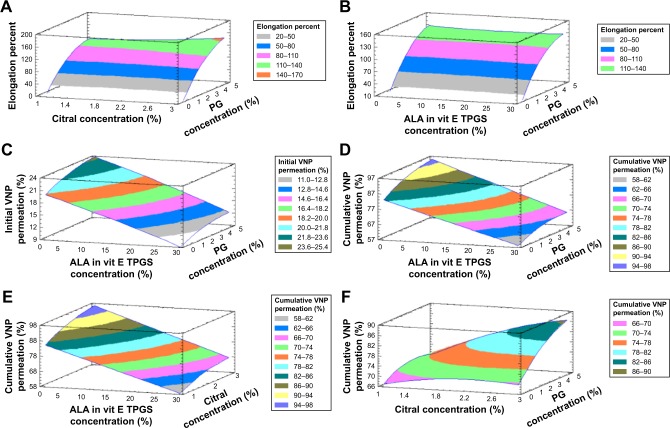
Figure 4.
Three-dimensional response surface plots showing the effects of the independent variables X1 and X2 at midpoint of X3 on the investigated dependent variables Y1 (A and B), Y2 (C), and Y3 (D–F).
Notes: X1: ALA in TPGS; X2: citral concentration; X3: PG concentration; Y1: elongation percent; Y2: initial permeation after 2 hours; and Y3: cumulative permeation after 24 hours.
Abbreviations: ALA, alpha lipoic acid; PG, propylene glycol; TPGS, D-α-tocopherol polyethylene glycol 1000 succinate; VNP, vinpocetine.

