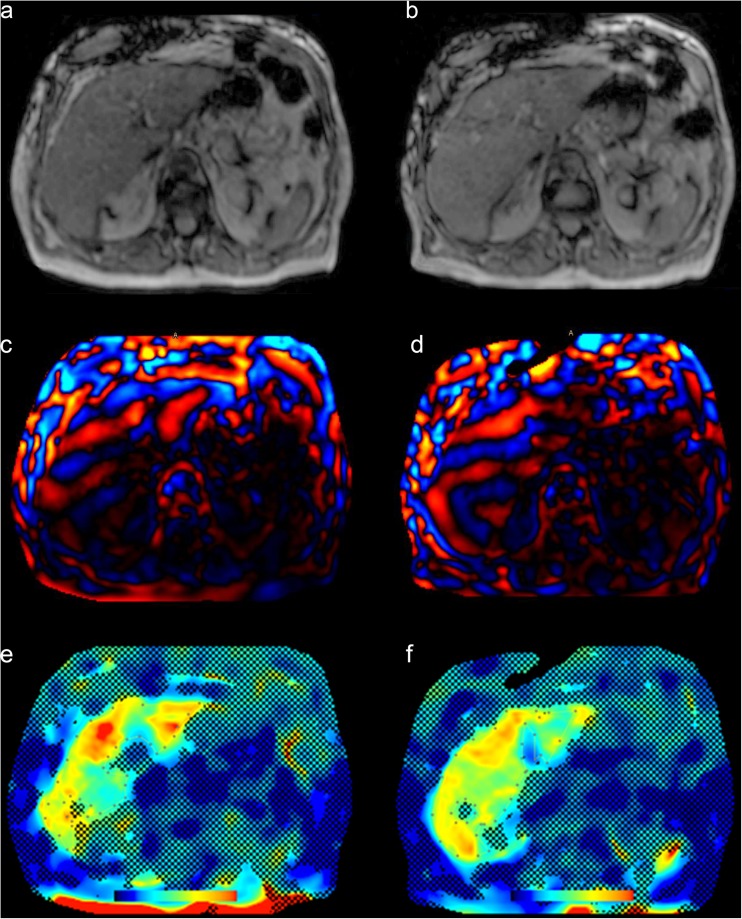
Fig. 4.
Example of hepatic MRE with stiffness measurements performed before (e) and after (f) Gd-EOB-DTPA administration together with the respective magnitude (a, b) and wave (c, d) images. The resulting mean hepatic stiffness value for (e) was 4.98 kPa and (f) was 4.83 kPa, both indicating fibrosis grade F3. The dotted line represents the measured area of the liver parenchyma within the 95% confidence map

