Fig. 3.

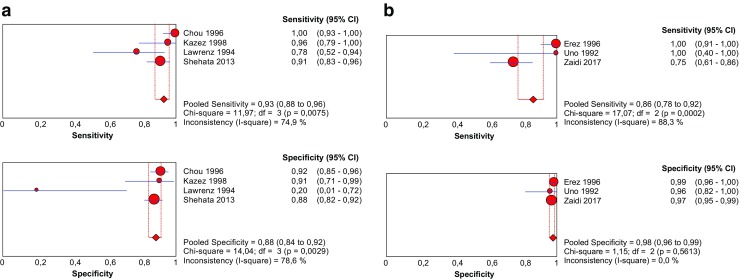
Pooled sensitivity and specificity forest plots including the 95% confidence intervals (CI) of a complete cases and b incomplete cases

Pooled sensitivity and specificity forest plots including the 95% confidence intervals (CI) of a complete cases and b incomplete cases