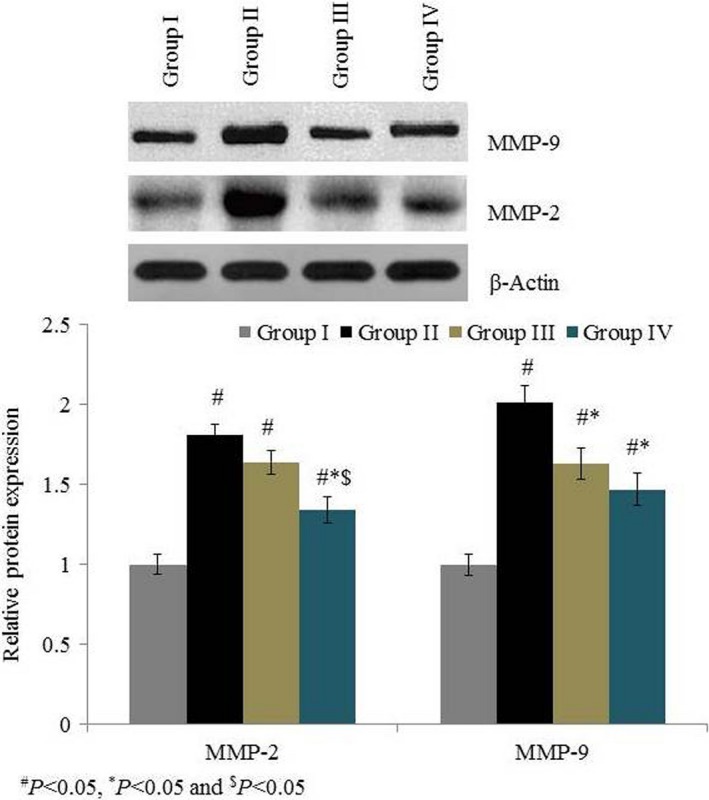
Figure 7.

Effects of omega‐6 fatty acids on the protein expression of MMP‐2 and MMP‐9 in the heart tissue homogenate of coronary heart disease‐induced rat model. # P < 0.05 vs group I, *P < 0.05 vs group II and $ P < 0.05 vs group III. n = 6. Values are shown as means ± standard error of the mean (SEM) [Colour figure can be viewed at wileyonlinelibrary.com]
