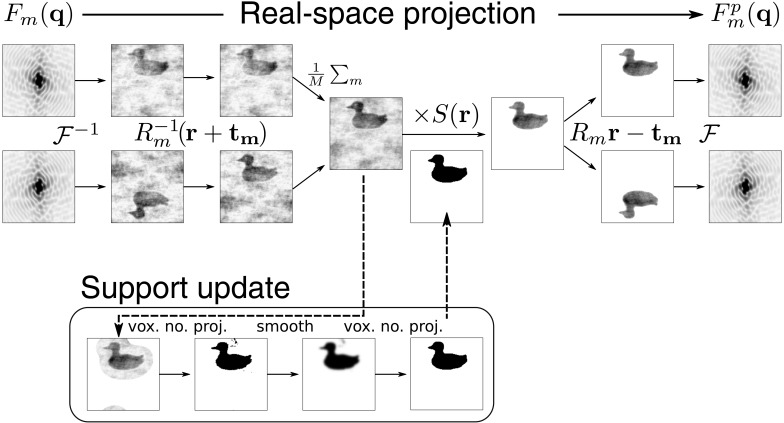
Figure 3.
Flow diagram illustrating the real-space projection operation for a 2D crystal. The crystal has the space group  and the unit cell consists of two ducks separated by a mirror plane cut horizontally across the middle of the array. Also illustrated is the procedure for updating the real-space support region, which is not part of the projection operation.

