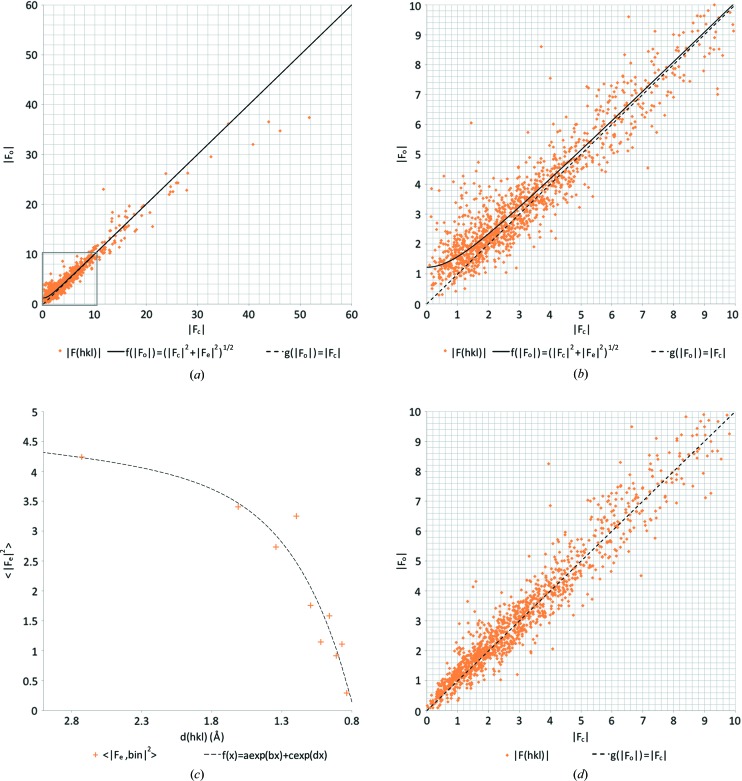
Figure 3.
Likelihood-based corrections for dynamical scattering. (a)  versus
 plot for IRELOH where
  is a hyperbolic function with an expected dynamical scattering error term of
  = 1.51 as determined by least-squares fitting, and where
  shows a perfect linear correlation. (b) Zoomed-in version on the lower intensity reflections, as marked with a grey box in (a). (c)
  as a function of the resolution, where we fitted an exponential curve
  with parameters a = 3.64, b = 0.058, c = −24.67 and d = −2.38. (d)
  versus
 plot after applying the likelihood-based corrections shows an improved correlation between
  and
and  with an error of
  = 0.33.

