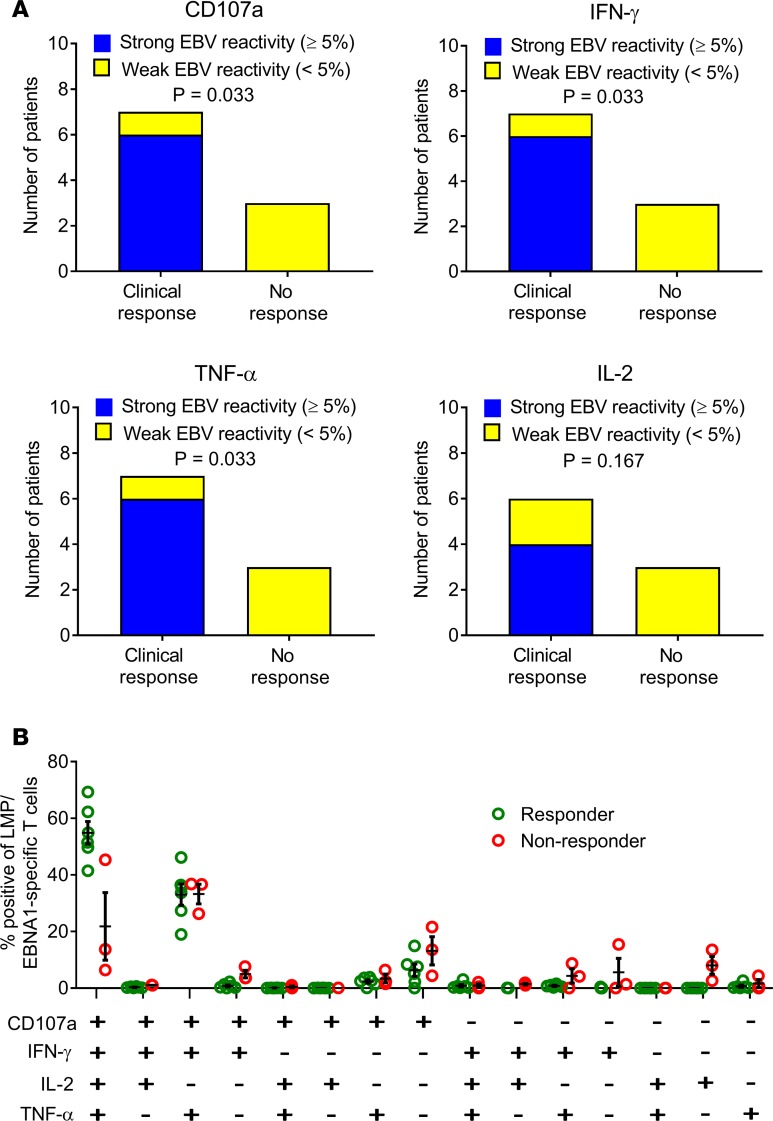
Figure 5. Relationship between EBV-specific CD8+ T cell reactivity of T cell product and clinical response to T cell therapy.
(A) Relationship between clinical response and the frequency of LMP/EBNA1-specific CD8+ T cells in the T cell product. Participants were grouped into those receiving T cell therapy with >5% of CD8+ T cells expressing a given individual cytokine (CD107a, IFN-γ, TNF-α, or IL-2) after recall with a peptide pool of CD8+ T cell epitopes encoded by EBNA1, LMP1, and LMP2A (strong reactivity) and those receiving T cell therapy with <5% reactivity (weak reactivity). A clinical response to T cell therapy was defined as clinical improvement at week 27 (the last clinical assessment in the study) compared with week 1 (immediately prior to the first T cell infusion). IL-2 expression was not assessed in the cells for participant 12. P values were calculated with Fisher’s exact test; n = 10 for CD107a, IFN-γ, and TNF-α; n = 9 for IL-2. (B) Proportion of LMP/EBNA1-specific CD8+ T cells expressing all the different combinations of the 4 cytokines (CD107a, IFN-γ, TNF-α, and IL-2) in the participants showing clinical improvement (Responder) compared with the participants not showing clinical improvement (Non-responder). This analysis was not able to be performed on the cells for participant 1 (n = 9). There was a higher proportion of EBV-specific polyfunctional T cells (expressing CD107a, IFN-γ, TNF-α, and IL-2) in the CD8+ T cells within the therapy administered to participants showing clinical improvement than in the therapy administered to participants not showing clinical improvement (P < 0.0001, multiple 2-tailed t test with the Holm-Sidak correction for multiple comparisons). Horizontal bars represent the mean and standard error of the mean.

