Abstract
Paramount to the efficacy of immune checkpoint inhibitors is proper selection of patients with adequate tumor immunogenicity and a robust but suppressed immune infiltrate. In colon cancer, immune-based therapies are approved for patients with DNA mismatch repair (MMR) deficiencies, in whom accumulation of genetic mutations results in increased neoantigen expression, triggering an immune response that is suppressed by the PD-L1/PD-1 pathway. Here, we report that characterization of the microenvironment of MMR-deficient metastatic colorectal cancer using multiplex fluorescent immunohistochemistry (mfIHC) identified increased infiltration of cytotoxic T lymphocytes (CTLs), which were more often engaged with epithelial cells (ECs) and improved overall survival. A subset of patients with intact MMR but a similar immune microenvironment to MMR-deficient patients was identified and found to universally express high levels of PD-L1, suggesting that they may represent a currently untreated, checkpoint inhibitor–responsive population. Further, PD-L1 expression on antigen-presenting cells (APCs) in the tumor microenvironment (TME) resulted in impaired CTL/EC engagement and enhanced infiltration and engagement of Tregs. Characterization of the TME by mfIHC highlights the interconnection between immunity and immunosuppression in metastatic colon cancer and may better stratify patients for receipt of immunotherapies.
Keywords: Immunology, Oncology
Keywords: Cancer, Cancer immunotherapy, Colorectal cancer
Multiplex fluorescent immunohistochemistry allows for a comprehensive characterization of the metastatic colorectal cancer immune microenvironment, revealing an important role for PD-L1+ APCs in immune suppression.
Introduction
A complex interplay exists between immune cells and tumor cells in the microenvironment of metastatic colon cancer (MCC) (1–3). As with many tumor histologies, the MCC immune infiltrate is composed of both proinflammatory (CD8+ cytotoxic T lymphocytes [CTLs], helper T cells, natural killer cells) and immunosuppressive (myeloid-derived suppressor cells, Tregs, tumor-associated macrophages) cells, the proportion of which influences the overall immune state of the tumor. Those that have a greater quantity of cytotoxic inflammatory cells tend to have more favorable outcomes, while those dominated by suppressive cells tend to succumb earlier to disease recurrence (4–6). While this applies to most tumor types, instances of improved survival, despite increased presence of suppressive cells, have been reported, demonstrating that the context in which these cells exist may play an important role in their effect on outcomes (7–9).
Components of both the innate and adaptive immune system influence cancer growth and progression and have demonstrable effects on disease manifestation, progression, and patient survival (2, 10). Inversely, characteristics of the tumor cells themselves play a significant role in shaping the phenotype and behavior of infiltrating immune cells. For example, increased mutational load caused by defects in mismatch repair (MMR) machinery creates neoantigens promoting an adaptive immune response (11, 12). The heightened presence of CTLs triggers a compensatory upregulation of suppressive immune elements aimed at balancing the inflammatory state (12). This renders MMR-deficient tumors susceptible to immunotherapies targeting suppressive immune checkpoints, notably, programmed death receptor (PD-1) and its ligand (PD-L1) (13, 14). Although trials demonstrated remarkable efficacy in MMR-deficient tumors, not all patients responded to checkpoint inhibition, while, paradoxically, some MMR-proficient tumors were effectively controlled, highlighting a need to better understand other aspects of the immune microenvironment (13).
While tumor epithelial cells (ECs) are the classic bearers of checkpoints, recent data suggest that tumor-resident antigen-presenting cells (APCs) upregulate surface expression of PD-L1 and may represent a more important source of immune suppression in the tumor microenvironment (TME) (15–17). PD-L1+ APCs in the human TME may directly mediate T cell suppression (17); however, murine data suggest a role in induction and development of Tregs, suggesting that immunosuppressive cells may synergize to impair CTL function and shape the tumor immune infiltrate (18). Improved understanding of the complex interactions between immune and tumor cells in the MCC microenvironment could identify patients suitable for treatment with available immunotherapies and foster the development of novel immune-based approaches.
The vast majority of data characterizing the immune microenvironment of MCC and other human tumors rely on standard immunohistochemistry (IHC) or flow cytometry of resected surgical specimens. The former has significant limitations due to relatively low sensitivity for poorly antigenic or expressed targets, difficulty in colocalizing stains, and the subjective nature of interpretation (19, 20). Flow cytometry allows for phenotyping using multiple colocalized markers, but the need to compensate for overlapping emission spectra can alter results and limit reproducibility. Immune cells must also be extracted from tissues and analyzed as single cells posing two substantial problems: (a) cells may be retained in stromal elements during processing and excluded from analysis and (b) lack of information regarding spatial relationships with tumor and neighboring immune cells disregards the context in which they exist and function, ignoring valuable spatial data.
We set out to explore the immune microenvironment of colorectal cancer liver metastases (CRLMs) in MMR-deficient and -proficient tumors using a novel tyramide signal amplification (TSA) multiplex immunophenotyping technique capable of staining 7 markers in formalin-fixed, paraffin-embedded tissue (20, 21). Use of TSA and the ability to colocalize stains allowed for phenotyping of 7 cell types (PD-L1– tumor cells, PD-L1+ tumor cells, CTLs, helper T cells, Tregs, PD-L1– APCs, PD-L1+ APCs); additionally, the in situ nature of the assay made measurements of cellular interactions possible. Using carefully annotated clinical data on tumor characteristics and patient outcomes, we demonstrated the important role of CTLs and their interaction with ECs and helper T cells on patient survival. By analyzing spatial context, we also revealed the effect of PD-L1+ APCs on shaping the immune microenvironment by enhancing Treg activity while suppressing CTL/EC engagement.
Results
High infiltration of CTLs results in improved survival following resection of CRLM.
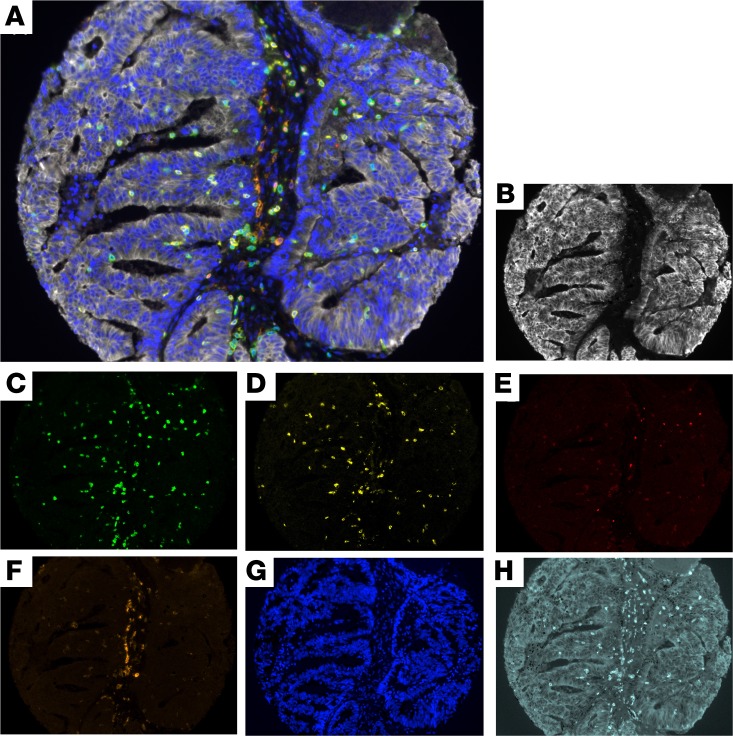
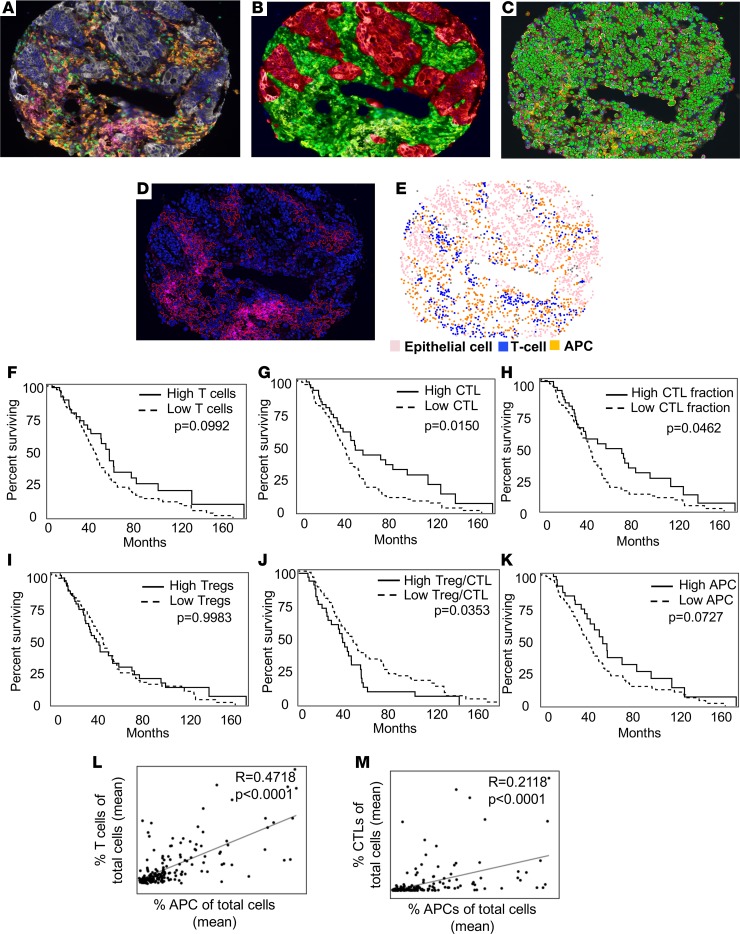
To study the infiltrating immune cells in MCC, a staining protocol was formulated to phenotype PD-L1– tumor ECs (pancytokeratin+PD-L1–), PD-L1+ tumor ECs (pancytokeratin+PD-L1+), CTLs (CD3+CD8+), helper T cells (CD3+CD8–FoxP3–), Tregs (CD3+CD8–FoxP3+), PD-L1–APCs (CD163+PD-L1–), and PD-L1+ APCs (CD163+PD-L1+) (Supplemental Table 1; supplemental material available online with this article; https://doi.org/10.1172/jci.insight.121932DS1). A spectral signature was determined for each fluorophore by single-antigen staining and captured using a multispectral fluorescent microscope, which records an image every 10 nm through the full-emission spectrum. This allowed for simultaneous capture of 7 different fluorophores into one composite image (Figure 1A), which could then be unmixed and separated into 6 unique images representing each fluorophore (Figure 1, B–F) and the nuclear stain DAPI (Figure 1G). An image of an unstained slide was obtained to measure and subsequently subtract autofluorescence from the composite image (Figure 1H). Using inForm (PerkinElmer) software, tissue segmentation training was performed to separate stromal and epithelial tumor elements (Figure 2, A and B). Cell segmentation using the DAPI nuclear stain allowed for accurate discrimination between each cell’s nucleus, cytoplasm, and membrane and ensured only live cells and not debris were measured (Figure 2C). The fluorescent intensity was recorded for each cell compartment (nucleus, cytoplasm, and membrane) to allow further cell phenotyping using R (Figure 2, D and E).
Figure 1. Multiplex fluorescent immunohistochemistry allows phenotyping of 7 unique cell types in the colorectal liver metastasis tumor microenvironment.
(A) A composite image was created incorporating all of the fluorophores present in a single core after multispectral imaging. (B–F) After construction of a single-stained library, spectral unmixing allows imaging of single fluorophores representing (B) pancytokeratin, (C) CD3, (D) CD8, (E) FoxP3, (F) CD163, and (G) DAPI. (H) A single unstained slide processed similarly to the tissue microarray (TMA) but without addition of primary antibodies or tyramide signal amplification (TSA) allows for measurement and subtraction of autofluorescence.
Figure 2. High CD8+ T cell infiltration predicts survival following resection of colorectal liver metastases.
(A–E) Multiplex fluorescent immunohistochemistry (mfIHC) followed by tissue and cell segmentation allows for accurate phenotyping of cells in the tumor microenvironment (TME). (A) A multispectral merged (composite) image (original magnification, ×20) (white, tumor epithelial cell; green, helper T cell; yellow, cytotoxic T lymphocyte [CTL]; red, Tregs; orange, antigen-presenting cell [APC]; magenta, PD-L1) subjected to tissue segmentation (B), cell segmentation (C), scoring (D), and generation of phenotypes (E). (F–K) Kaplan-Meier survival curves created for high cell infiltration (upper quartile) compared with all other available patients for (F) T cells, (G) CTLs as fraction of total cells, (H) CTLs as fraction of T cells, (I) Tregs, (J) the total Treg/CTL ratio, and (K) APCs. (L and M) Correlation analysis between (L) T cells as a fraction of total cells and (M) APCs and CTLs as a fraction of total cells and APCs. Pearson correlation coefficient and P values are shown for each pair. CRLM, colorectal liver metastasis.
The immune microenvironment of CRLM from 177 patients was studied using mfIHC. Immune cells tended to reside in the stromal component of tissues, although intercalation of T cells among tumor cells was occasionally present (Supplemental Figure 1). There was modest variability in degree of immune infiltration among patients, with some samples consisting of scarce immune cellular infiltrate (Supplemental Figure 1, A and B), while in other patient samples the immune infiltrate represented a majority of the population (Supplemental Figure 1, C and D). In those with high immune infiltration, the overall proportion of the cellular phenotypes was substantially varied, as was EC and APC PD-L1 expression (Supplemental Figure 1, E–P). To ensure an accurate sampling of tumors, 3 cores were included for each patient after pathologic review confirmed the presence of viable tumor and lack of necrosis. Because intratumoral variability existed among patients, with some cores appearing nearly identical and others vastly different (Supplemental Figure 2 and Supplemental Table 2), an average of values was calculated for each patient using available cores.
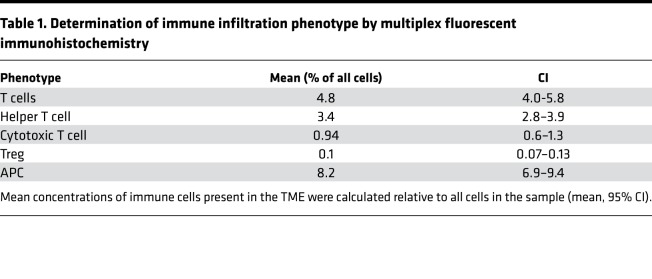
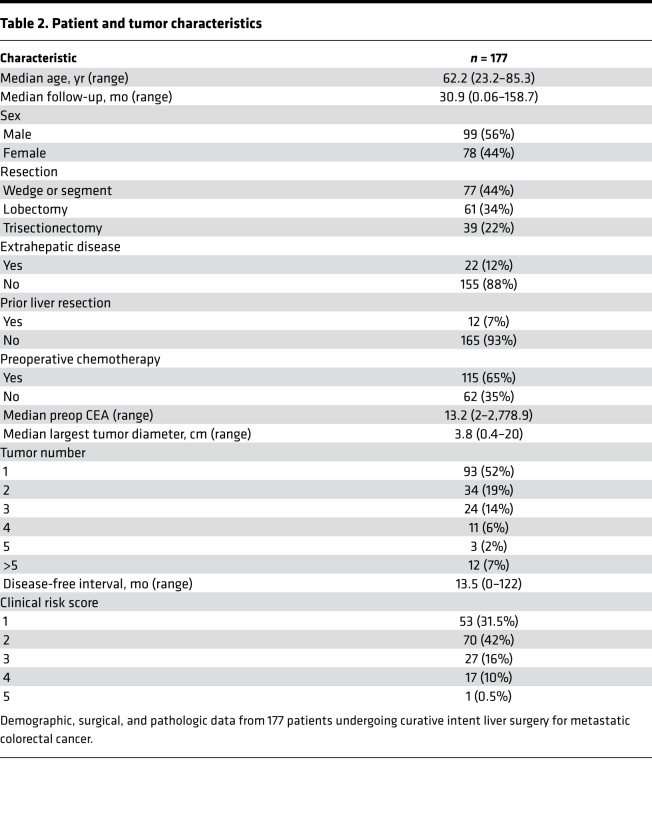
After cell segmentation of the nucleus, cytoplasm, and membrane and scoring of the fluorescent intensity of each compartment, cells were phenotyped and counted using previously mentioned markers (Supplemental Table 1). APCs represented the most abundant immune cell type followed by helper T cells (Table 1). Tregs were infrequently seen and were outnumbered by CTLs at a ratio of 10 to 1. Using annotated patient data, the effect of immune infiltration on overall survival was calculated. Clinical characteristics are presented in Table 2. The median follow-up was 31 months (range 0.7–159 months). T cells represented a mean 4.8% of the total cells of CRLM samples but had no statistically significant effect on outcome, with median survivals of 50 and 39 months for high and low T cell infiltrates, respectively (P = 0.0992) (Figure 2F). CTLs constituted a mean 0.9% of all cells within patient samples and ranged from 0% to 15%. Those with high total CTLs (upper quartile; >2.2% of total cells) had longer median survival, 47.5 months compared with 38.9 months in the remainder (P = 0.0150) (Figure 2G). Of the total T cells present, a mean of 11.6% (CI 9.5%–13.8%) were CTLs, and a high proportion of CTLs relative to total T cells was also associated in improved survival (Figure 2H). Interestingly, while Treg infiltration had no effect on survival (Figure 2I), when measured relative to CTLs, a high Treg/CTL ratio was associated with a reduced duration of survival (median, 43.0 months vs. 35.1 months; P = 0.0353) (Figure 2J). Increased APC infiltration relative to total cells resulted in a median survival of 50 months compared with 37.3 months in the low-infiltrating group (P = 0.0727) (Figure 2K). There were no survival differences in those with elevated helper T cells or with greater infiltration of all assayed immune cells combined (data not shown). We observed a positive correlation between abundance of total T cells and CTLs with APCs (Figure 2, L and M), suggesting either a common chemoattractant or influence of one on the accumulation of the other in the microenvironment. There was no statistical relationship between APC and Treg infiltration, confirming these findings were not related to nonspecific increased immune cell accumulation (Supplemental Figure 2C).
Table 1. Determination of immune infiltration phenotype by multiplex fluorescent immunohistochemistry.
Table 2. Patient and tumor characteristics.
PD-L1 expression increases the distance between CTLs and ECs in the CRLM TME.
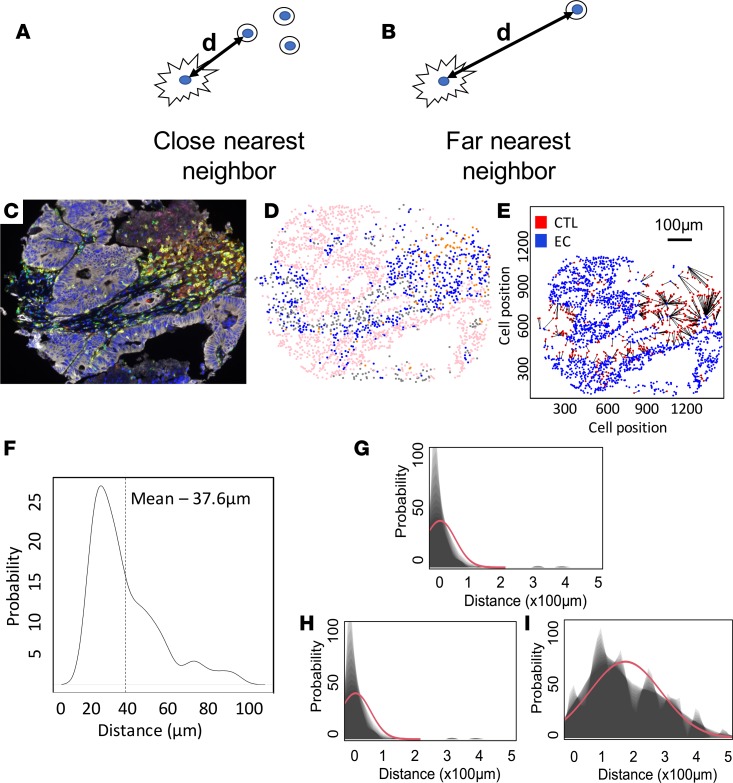
Utilization of flow cytometry to characterize the immune cellular infiltrate allows for accurate phenotyping of cells but fails to capture spatial relationships that may better reflect immune cell function and interaction. To better examine this, after cell phenotyping, individual cells were assigned an identification number with x and y coordinates that could be used to determine their relationship to every other cell in the core. This allowed for calculation of intercellular distances and determination of whether certain populations of cells were residing closer or farther away from one another (Figure 3, A and B). Using R software, the distance between CTLs, ECs, and other immune cells was calculated for each set of cores and the mean separation was determined (Figure 3, C–F). CTLs tended to reside in close proximity to helper T cells and APCs but tended to be further away from Tregs (Supplemental Table 3). The mean distance from CTLs to the closest EC was 32.1 μm (CI: 27.2–37.26 μm), with CTLs located further away from PD-L1+ compared with PD-L1– ECs at 181.9 μm (CI: 158.48–205.39 μm) and 31.1 μm (CI: 24.00–38.16 μm), respectively (Figure 3, G–I). A similar association was seen with the relationship of PD-L1 status of APCs and proximity to CTLs (data not shown), suggesting that expression of the checkpoint itself may effect behavior of CTLs and distribution within tumors.
Figure 3. PD-L1 expression on epithelial cells is associated with greater distance to cytotoxic T lymphocytes.
(A and B) Schematic representation of close and far nearest neighboring cell, with d representing distance in microns. (C–E) After multiplex fluorescent immunohistochemistry (mfIHC; original magnification, ×20), cells were phenotyped and assigned coordinates. (E) Distances between individual cytotoxic T lymphocytes (CTLs) and epithelial cells (ECs) were recorded for all imaged cores (n = 177 patients). (F) A weighted mean distance was calculated for all cells utilizing all available cores per patient. (G–I) Spatial relationship between CTLs and (G) total ECs, (H) PD-L1– ECs, and (I) PD-L1+ APCs for all patients in the cohort.
Engagement of CTLs with ECs and helper T cells is associated with improved survival.
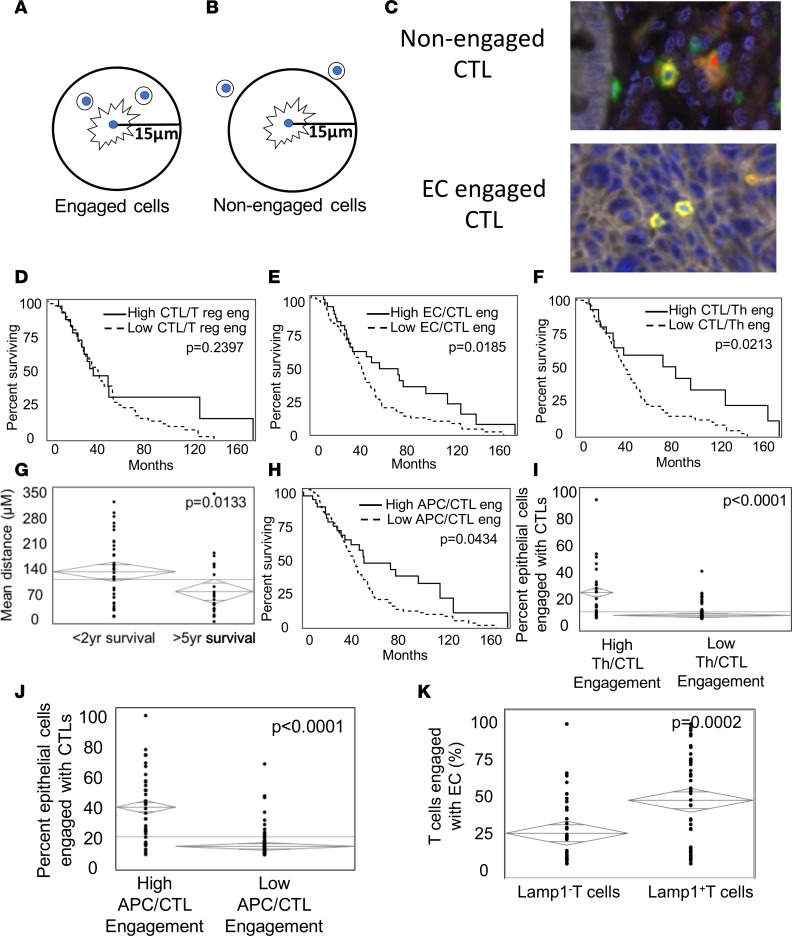
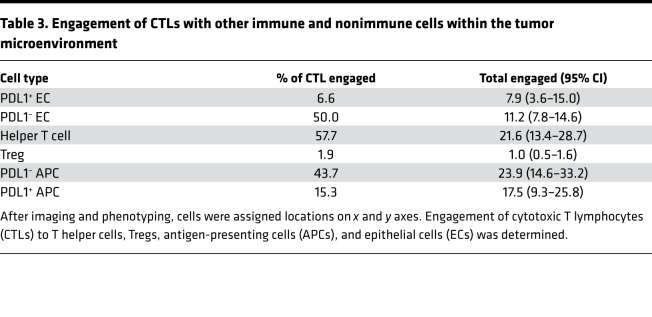
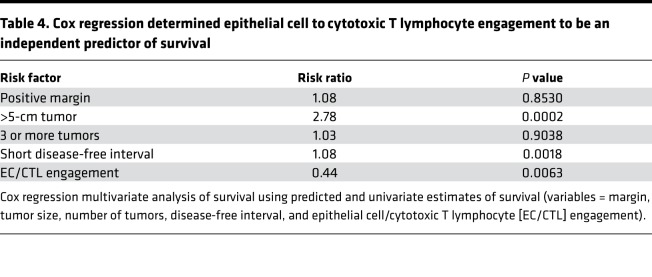
In order to affect their function and transmit excitatory or inhibitory signals, immune cells must be in close proximity or physically touch one another (22). Phenotyping of cells in situ allows determination of cells whose positions are close enough to be considered “engaged” in immune activity (Figure 4, A and B). To characterize cellular engagement within CRLM, after image capture and phenotyping, a circular area with a radius of 15 μm was selected around each T cell and a radius of 40 μm around APCs and ECs, and the presence of other immune cells or ECs was recorded (Figure 4C). The median frequency of cells within this engagement zone was calculated (Supplemental Figure 3, A–D), as was the percentage of engaged cells relative to total cells present in the core. Consistent with data on intercellular distances, half of the CTLs were engaged with PD-L1– ECs while only 6.6% were in close proximity to PD-L1+ cells (Table 3). A similar trend was seen with APCs, where CTLs were engaged with 43.7% and 15.3% of PD-L1– and PD-L1+ APCs, respectively. CTLs were rarely associated with Tregs, while they most commonly engaged with helper T cells (57.7%). To ensure CTL/EC engagement and intercellular distances were not simply a marker of increased infiltration, samples were divided into quartiles of CTL infiltration. Paradoxically, those with the highest CTL infiltration had a trend toward greater intercellular distance and significantly less engagement (Supplemental Figure 3, E and F). To determine the effect of immune cell engagement on survival, frequency and total engagement of immune cells with other immune cells and ECs was calculated. There was no demonstrable effect of CTL/Treg engagement on survival (Figure 4D). A higher percentage of ECs actively engaged with CTLs correlated with a significant prolongation of survival following resection of CRLM (52.3 vs. 42.5 months; P = 0.0185) (Figure 4E). Along with ECs, engagement of CTLs with helper T cells was associated with improved overall survival, as high CTL/T helper cell engagement (upper quartile) resulted in a median survival of 77.9 months compared with 39.0 months in the remainder (P = 0.0213) (Figure 4F). To determine if the distance from CTLs to T helper cells was protective, we compared patients who succumbed early of disease after surgical resection (<2 years) to long-term survivors (>5 years) and found significantly closer mean distances in the latter (Figure 4G). A similar trend was identified when measuring APC/CTL engagement, where higher frequencies in the TME resulted in significantly improved median survival (47.5 months vs. 39.3 months; P = 0.0434) (Figure 4H). To study the source of this improved outcome, we examined cell distance and engagement of CTLs and ECs in those with high and low CTL/T helper cell and APC engagement and found significantly greater EC/CTL engagement in both (Figure 4, I and J). Multivariate survival analysis confirmed that CTL/EC engagement was an independent predictor of survival with a risk ratio of 0.44 (P = 0.0063) (Table 4). To determine if CTL/EC engagement was associated with increased biologic activity, tissue was stained for lysosomal-associated membrane protein 1 (LAMP1), a marker of T cell activation. Data revealed a significantly higher percentage of activated T cells when engaged with ECs when compared with those that were not engaged (Figure 4K).
Figure 4. Cytotoxic T lymphocyte engagement with epithelial cells and antigen-presenting cells is associated with improved overall survival.
(A and B) Schema depicting cells that were (A) engaged or (B) nonengaged based on a radius of 15 μm from the center of the nucleus of a cytotoxic T lymphocyte (CTL). (C) Examples of nonengaged and engaged CTLs in the tumor microenvironment (TME) (original magnification, ×40). (D–F) Kaplan-Meier survival curves created for 177 patients with high (upper quartile) (D) CTL/Treg engagement, (E) epithelial cells/CTL (ECs/CTL) engagement, and (F) CTL/helper T cell engagement. (G) Mean distance between CTLs and helper T cells in patients with short- and long-term survival (ANOVA; P = 0.0133). (H) Survival cure for patients with high (upper quartile) CTL/antigen-presenting cell (CTL/APC) engagement. (I and J) ANOVA analysis of CTL/EC engagement relative to high (I) helper T cell/CTL engagement and (J) APC/CTL engagement. (K) Average incidence of Lamp+ and Lamp– T cells that were engaged with ECs in the TME.
Table 3. Engagement of CTLs with other immune and nonimmune cells within the tumor microenvironment.
Table 4. Cox regression determined epithelial cell to cytotoxic T lymphocyte engagement to be an independent predictor of survival.
PD-L1+ APCs shift the immune microenvironment to a more suppressive state.
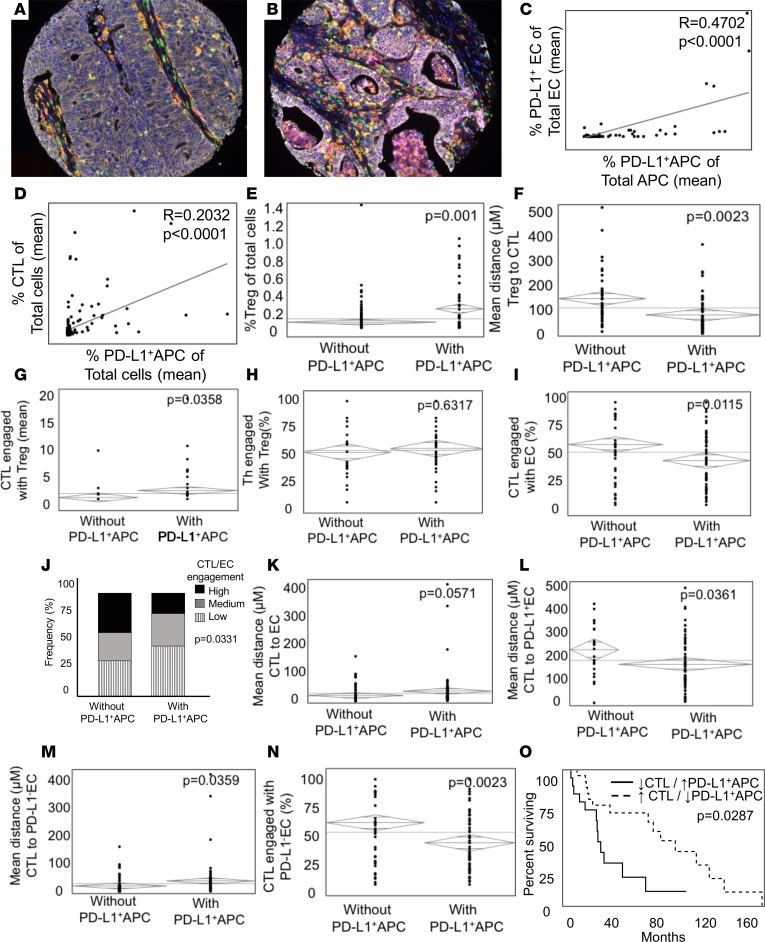
It has been suggested that the presence of immune checkpoints on APCs in the TME greatly impairs tumor immunity (15, 16, 23). To investigate their role in shaping the immune infiltrate of CRLM, APCs were stained for the presence of surface PD-L1 (Figure 5, A and B). Forty-three percent of patients had PD-L1+ APCs present, and the population ranged from 1% to 89% of all APCs present in the core. There was a strong correlation between the presence of PD-L1 on APCs and ECs within samples (Figure 5C). Interestingly, while there was only 1 patient who had PD-L1+ ECs in the absence of PD-L1 expression on APCs, there were 48 patients (27% of total) in whom PD-L1 was only found on infiltrating APCs. There was also a strong association between the degree of PD-L1+ APC infiltration and CTLs (Figure 5D), suggesting a possible role for these cells in controlling CTL activation (12). To better study this immunosuppressive function, patient samples were separated into those with and without infiltrating PD-L1+ APCs and subjected to phenotypic and spatial characterization. Examination revealed that, when PD-L1+ APCs were present, CTLs were located closer to Tregs, which were more abundant and more likely to be engaged (Figure 5, E–G). This phenomenon appeared to be APC specific, as tumors with high ratio of PD-L1+ ECs did not show a difference in Treg/CTL engagement (data not shown). Contrary to CTLs, there was no effect of PD-L1+ APC infiltration on Treg/helper T cell engagement (Figure 5H) or distance to nearest neighbor. Pronounced differences were present in PD-L1+ APC-infiltrating tumors with respect to CTL function, as engagement with ECs was significantly decreased and distance from CTLs to ECs increased (Figure 5, I–K). This appeared to be specific to PD-L1– ECs, as those expressing PD-L1 saw no change in CTL engagement and actually maintained a significantly closer cell-to-cell distance (Figure 5L). Contrary to this, CTLs were far less engaged with PD-L1– ECs and were a located a greater distance away in PD-L1+ APC-infiltrating tumors (Figure 5, M and N). Determining the effect of PD-L1+ APCs on survival is difficult because of the strong association with the protective infiltrating CTLs. When considering only patients without association of these variables, we discovered a correlation with significantly shorter survival time in those whose tumors had low levels of infiltrating CTLs and a high proportion of PD-L1+ APCs (median 28 vs. 78 months; P = 0.0287) (Figure 5O). To validate these findings, an independent cohort was constructed consisting of 25 patients with colorectal metastases to liver as well as bone and lung. Tissues were subjected to mfIHC as above (Supplemental Figure 4, A and B), and phenotypic and spatial data were gathered for infiltrating immune cells. In patients with PD-L1+ APCs, analysis revealed a trend toward increased Treg infiltration (Supplemental Figure 4C), which tended to be closer (Supplemental Figure 4D) and more engaged with CTLs (Supplemental Figure 4E). As with our original patients set, the presence of PD-L1+ APCs was associated with a decrease in CTL/EC engagement (Supplemental Figure 4F), which was particularly pronounced for PD-L1– ECs (Supplemental Figure 4G).
Figure 5. Infiltration of PD-L1+antigen-presenting cells shapes the immune microenvironment of colorectal liver metastases.
(A and B) Representative multiplex images (original magnification, ×20) (white, epithelial cell [EC]; green, helper T cell; yellow, cytotoxic T lymphocyte [CTL]; red, Treg; orange, antigen-presenting cell [APC]; magenta, PD-L1) of colorectal liver metastases (CRLM) with (A) low and (B) high infiltration of PD-L1+ APCs (coexpressing orange [CD163] and magenta [PD-L1]). (C and D) Correlation analysis between (C) PD-L1+ EC and PD-L1+ APCs and (D) CTLs and PD-L1+ APCs. Pearson correlation coefficient and P values are shown for each pair. (E–I) ANOVA comparing patients with (n = 72) and without (n = 80) infiltrating PD-L1+ APCs relative to (E) Treg infiltration, (F) distance from Tregs to CTLs, (G) engagement of Tregs and CTLs with ECs, (H) engagement of Tregs with helper T cells, and (I) engagement of Tregs with CTLs. (J) Patient CTL/EC engagement was categorized by terciles and compared with PD-L1+ APC infiltration. (K–O) ANOVA was used to compare patients with or without PD-L1+ APCs relative to (K) distance from CTLs to ECs, (L) mean distance from CTLs to PD-L1+ ECs, (M) mean distance from CTLs to PD-L1– ECs, and (N) engagement of CTLs with PD-L1– ECs. (O) Kaplan-Meier survival curve for patient with infiltration of numerous (upper quartile) CTLs and few (lowest quartile) PD-L1+ APCs (n = 16) compared with those with few CTLs (lowest quartile) and numerous PD-L1+ APCs (highest quartile) (n = 13).
Microsatellite instability enhances CTL infiltration, resulting in increased CTL/EC engagement and survival.
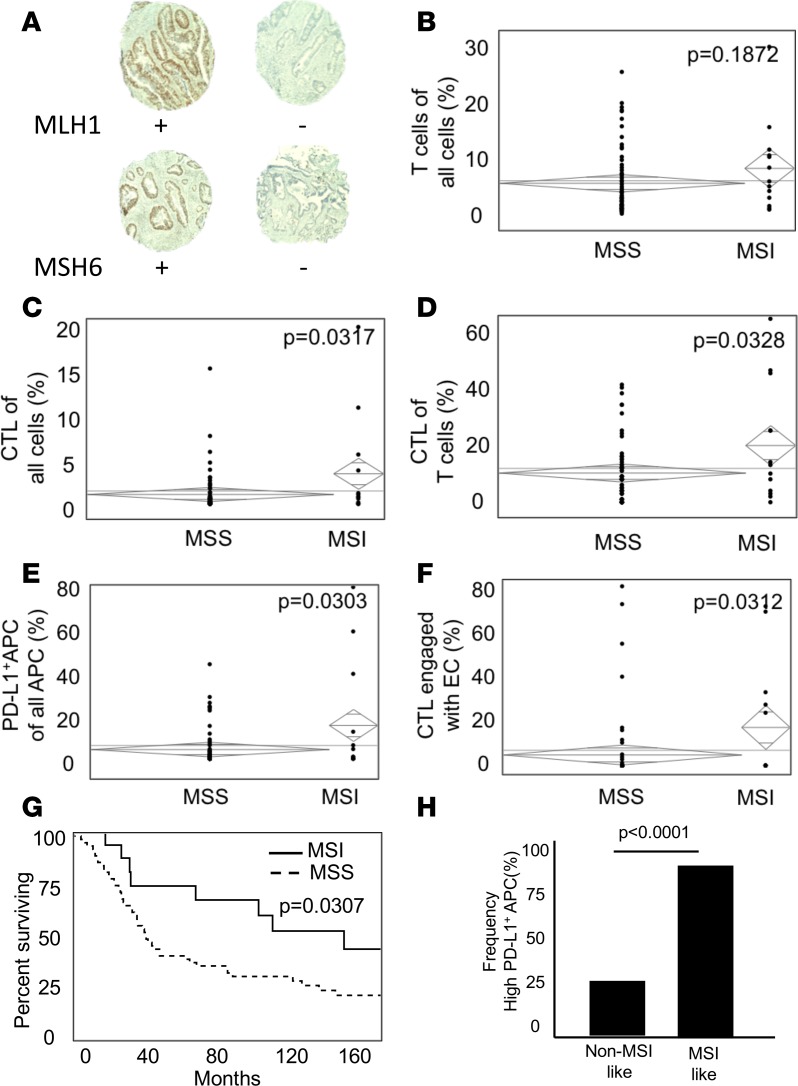
Microsatellite instability (MSI) results from deficiency in DNA MMR proteins, leading to accumulation of mutations and subsequent immunogenic neoantigens (24). To determine the effect on the immune microenvironment in CRLM, a subset of 77 patients was subjected to IHC for the MMR proteins MLH1, MSH2, MSH6, and PMS2 (Figure 6A). Deficiency of one or more proteins was encountered in 13 (16.8%) patients, and these were deemed MSI. There were no differences between the groups with regards to mean tumor size, tumor number, or disease-free interval (Supplemental Table 4). While a trend toward increased T cell infiltration existed in MSI patients, CTLs were significantly more abundant at 2.15% of total cells compared with 0.69% in microsatellite stable (MSS) patients (P = 0.0317) (Figure 6, B–D). Helper T cells tended to be less abundant by contrast (Supplemental Figure 5A). A greater infiltration of PD-L1+ APCs was also observed in MSI-high patients (Figure 6E), who also had more PD-L1+ ECs (Supplemental Figure 5B). Paralleling the increase in CTLs was a greater frequency and absolute number of CTLs actively engaged with ECs (24.4% and 15.9% in MSI and MSS patients, respectively; P = 0.0312) (Figure 6F and Supplemental Figure 5C) in the TME, which may play a role in the improved overall survival experienced by the MSI patients in this subset (median survival, 116.7 months vs. 45.5 months; Figure 6G). Of note, total immune cell infiltration (all T cells plus APCs) did not differ between the 2 patient populations (Supplemental Figure 5D). A subset of 12.5% of MSS patients was identified, with similar spatial relationships of immune cells defined by heightened presence and engagement of CTLs and ECs. Of these patients, 100% expressed high levels of PD-L1 in their tumors compared with 25% in the remaining MSS patients (Figure 6H).
Figure 6. Patients with microsatellite instability have greater infiltration and engagement of cytotoxic T lymphocytes in the tumor microenvironment.
(A) Representative images of MLH1 and MSH6 positive and negative tumors (original magnification, ×10). (B–E) ANOVA was used to compare microsatellite stable (MSS) (n = 64) and microsatellite instable (MSI) (n = 13) patients relative to infiltrating (B) T cells of total cells, (C) cytotoxic T lymphocytes (CTLs) of total cells, (D) CTLs as a percentage of T cells, and (E) PD-L1+ APCs of total APCs. (F) Comparison of CTL/EC engagement between MSS and MSI patients. (G) Kaplan-Meier survival curve for MSS and MSI patients. (H) Frequency of high PD-L1+ APCs (upper quartile) in MSS patients (n = 64) possessing MSI-like (n = 8) and non-MSI-like (n = 56) immune infiltrates.
Discussion
Understanding not just the presence but interactions of immune cells in the TME is crucial to identifying important prognostic factors and selecting patients for current and future immunotherapeutic intervention. Prior studies in MCC have demonstrated an important role for immune cell infiltration in predicting pathologic features and clinical outcome (25–28). It is well accepted that infiltration of CTLs is associated with active tumor immunity (29) and portends a more favorable prognosis (reviewed in ref. 5). Helper T cells are also felt to favor local immune activation, and elevated levels in the TME are associated with improved disease-specific outcomes (30, 31). Considerable controversy exists regarding the role of APCs and Tregs in overall survival, with some studies citing protective effects while others report hem to be deleterious (4, 32, 33).
Previously, the study of the immune microenvironment has relied on chromogenic IHC and occasionally flow cytometry. The former suffers from limitations in phenotyping due to constraints of multicolor staining, variability in interpretation, and difficulty in visualizing minimally expressed antigens. Flow cytometry allows for more accurate phenotyping but necessitates single-cell suspension, limiting the ability to truly understand their context and engagement in the TME. Multiplex fluorescent IHC (mfIHC) applies the multiantigen recognition and reproducibility of flow cytometry with retention of spatial elements available from routine IHC (20). This allows one to distinguish passively present immune cells, such as those residing in intratumoral lymph nodes from actively engaged cells in close proximity to targets or APCs. Prior studies in head and neck cancer have demonstrated this technique to be far superior and have changed long-held beliefs about the role of suppressive cells in this disease (9).
In the present study, mfIHC was used to characterize the immune microenvironment of CRLM from 177 patients who underwent curative intent metastasectomy. Utilization of 7 colors allowed accurate phenotyping of T cells, ECs, and APCs as well as their surface expression of the immune checkpoint PD-L1. A wide range of immune infiltration and cell phenotypes exists among the patients examined, with some TMEs dominated by lymphocytes while others were composed primarily of APCs. Unlike other tumor types, there was a relative paucity of Tregs, and they had little effect alone on overall survival, contrary to prior reports (7, 9). The principle benefit of phenotyping cells in situ was the ability to record distances between cells and determine if they were close enough to be potentially engaged with one another, leading to active communicating or destruction (21). To confirm that close proximity reflected functionality, T cells were costained for the degranulation marker LAMP1 (CD107a), previously described as a marker of CTL activity (34). A significantly higher proportion of LAMP1+ T cells was engaged with ECs, validating our assumptions. Also consistent with our hypothesis was the finding that CTLs tended to be closer to PD-L1– ECs when compared with PD-L1+ ones, suggesting that the checkpoint was inhibiting proper cell recognition, homing, and/or proliferation (35).
Using annotated patient data, we were able to determine the effect of immune cell engagement on survival and pathologic characteristics of the metastases. mfIHC demonstrated that increased engagement of ECs with CTLs resulted in improved overall survival, highlighting the importance of actively involved CTLs in disease control and outcomes. While localization of CTLs with Tregs had no appreciable effect on survival, engagement of CTLs with helper T cells and APCs correlated with a more favorable prognosis. One potential mechanism for this is the observed dramatic increase in EC/CTL engagement in the setting of elevated APC/CTL engagement, suggesting the latter may be priming CTLs for cytotoxic destruction. To ensure that these findings were not simply a function of increased overall immune cell infiltrate, a similar analysis was done in immune cell–rich and –poor samples with similar results (data not shown).
While PD-L1 expression on ECs is classically thought to suppress CTL function in the TME, emerging data suggest an equally important role for tissue-resident PD-L1+ APCs (9, 12, 15). Because mfIHC allows for accurate colocalization of antigens while maintaining tissue architecture, it represents an ideal method for investigating the consequences of these cells on the immune infiltrate. To determine the role of checkpoints in shaping the immune microenvironment of CRLM, both APCs and ECs were stained for PD-L1. While there was a close association between abundance of PD-L1+ ECs and PD-L1+ APCs in tumors, there were a subset of patients who had high levels of checkpoint-bearing APCs in the absence of EC expression, highlighting the need to consider these when categorizing checkpoint status. Consistent with prior reports, increased APC PD-L1 expression paralleled the accumulation of CTLs, suggesting a compensatory response to inflammation and a possible mechanism for immune escape (12, 36). In patients with high levels of infiltrating PD-L1+ APCs, an increase in the population and function of Tregs in the TME was suggested, as demonstrated by increased engagement and decreased distance to CTLs. This is consistent with murine data showing that PD-L1 regulates the development and function of Tregs and the first report of this observation in human colon cancer (18, 37). Other observed immunosuppressive effects were decreased CTL/EC engagement and greater distance between CTLs and PD-L1– ECs while they were inexplicably driven closer to PD-L1+ ECs. The role of PD-L1+ APCs in shaping an immunosuppressive microenvironment was validated in an independent cohort of patients. Because of the significant associations between abundance of CTLs and PD-L1+ APCs, direct paths linking inhibitory APCs to patient outcomes are difficult to ascertain. When CTLs were abundant and PD-L1+ APCs infrequent, patients fared better, with an overall survival of 78 months, nearly double than that experienced by those with low CTLs. This represents the first report to our knowledge demonstrating the immunosuppressive effects of PD-L1+ APCs in the TME, in situ, and highlights the need for further study of these cells and efforts to mitigate their function to improve CTL-mediated tumor destruction. It also demonstrates the complexity of the immune microenvironment, with tight relationships among infiltrating CTLs, PD-L1+ APCs, and Tregs likely necessitating consideration of more precise combination immunotherapy for the treatment of distinct patient subsets.
Unlike tumors, such as melanoma and renal cell carcinoma, MCC has proven relatively resistance to anti–PD-L1 therapy (38–40). An exception to this are tumors with defective MMR, in whom microsatellite instability results in abundant neoantigen presentation and CTL response (12). Sixteen percent of patients in our study were found to be MSI, which is greater than previous reports and likely related to the highly selected nature of this patient population undergoing curative intent liver resection for metastatic disease (41). These patients tended to have more abundant CTLs, which were increasingly engaged with ECs, with a trend toward decreased immunosuppressive Tregs. Increased observed PD-L1 expression on ECs and APCs was consistent with the established improved efficacy of PD1 inhibition in MSI colorectal cancer, which led to its recent approval by the Food and Drug Administration (13). In an effort to identify further patients who may benefit from immune-based therapies, the phenotypic and spatial characteristics of MSS patients (n = 64) were examined. A small subset (12.5%) was found with high CTL infiltration, which was frequently engaged with ECs, mirroring the environment seen in MSI patients. A closer look revealed that all of these patients had high levels of intratumoral PD-L1+ APCs compared with only 25% in the remaining MSS patients. This suggests not only that these patients may benefit from checkpoint inhibition, but that mfIHC with spatial analysis may represent a superior way of selecting patients for immunotherapies. EC PD-L1 expression alone may be less predictive of responsiveness to therapy than factors such as cellular engagement or checkpoint expression on infiltrating APCs. For example, while most instances of high PD-L1 expression paralleled increases in CTL accumulation, a subgroup of patients existed with high checkpoint inhibition in the absence of a substantial immune infiltrate. It is likely that these patients would receive little benefit from treatments aimed at disrupting the PD1/PD-L1 axis. Further study of the relationship between these findings and the efficacy of immunotherapy is warranted.
Conclusions.
In summary, spatial characterization of immune cells sheds light on the TME of colorectal CRLMs and identified possible novel mechanisms of PD-L1–mediated immunosuppression. Current approved biomarkers to predict response to therapy, which include surface expression of checkpoint ligands and markers of neoantigen production, fail to capture characteristics of the entire immune infiltrate, leading to potential under treatment of patients. These results highlight the interconnection between inflammation and immunosuppression and provide a potentially superior method to stratify patients for receipt of single or combination immunotherapies.
Methods
Patients.
The study population consisted of 195 patients who underwent consecutive curative intent resection of colorectal liver metastases. Patient and tumor characteristics were maintained prospectively on a dedicated database and survival was updated regularly. After review of whole slides by a trained gastrointestinal pathologist, three 0.6-mm diameter cores were collected from tissue blocks for inclusion on a tissue microarray (TMA).
Multiplexed IHC staining.
Five-micron slices were cut from the TMA onto charged slides and slides were baked at 60°C for 1 hour. Deparaffinization with xylene for 10 minutes in triplicate was followed by 100%, 90%, and then 70% ethanol for 10 minutes each. Slides were washed in deionized water for 2 minutes followed by neutral buffered formalin for 30 minutes. The Opal 7 manual kit (PerkinElmer) was used according to the manufacturer’s instructions. After each antigen retrieval, slides were stained with antigen-specific primary antibodies followed by Opal Polymer (secondary antibody). Application of the Opal TSA created a covalent bond between the fluorophore and the tissue at the site of the HRP. Each antigen retrieval step was performed using either AR6 or AR9 antigen retrieval buffer, which allowed for the removal of prior primary and secondary antibody while the fluorophore remained covalently bonded to the tissue antigen. This allowed for use of the same host species antibody while also amplifying the signal. Validation that subsequent antigen retrieval steps removed the prior primary antibody has been reported (20). See Supplemental Table 5 for antibodies and dilutions. Eighteen patients were excluded due to high levels of necrosis or fibrosis or loss of 2 or more cores. A subset of samples was subjected to routine IHC for the MMR proteins MLH1, MSH2, MSH6, and PMS2, and absence was determined by pathologic review.
Multispectral imaging.
Imaging was completed using the Mantra Quantitative Pathology Work Station. One image per core was captured at ×20 magnification. All cube filters were used for each image capture (DAPI, CY3, CY5, CY7, Texas Red, Qdot). The incorporated saturation protection feature was set at an exposure time of 250 ms.
Image analysis.
Images were analyzed using inForm Cell Analysis software (Perkin Elmer). All 455 images were batch analyzed using a subset of 179 randomly chosen tissue core images. A library was made using single-antigen staining for each fluorophore and used for unmixing and validation of the multiplex fluorescent composite staining, ensuring no spectral overlap between fluorophores. Using the inForm training software, both tissue and cell compartments were identified and segmented. Tissue was segmented into stroma and epithelial cancer compartments, while cells were segmented in to nucleus, cytoplasm, and membrane compartments. DAPI counterstain was used to determine the size and shape of each nucleus, and an x and y coordinate was assigned to each cell in each of the cores. The cytoplasm shape, thickness, and distance from the nucleus were calculated by the automated system using fluorescence of CD8, CD163, and CD3. The distance from the center of the nucleus to the outer surface of the cytoplasm was set at 8 pixels from the center of each nucleus, where 1 pixel is 0.496 microns. The membrane shape and distance from the nucleus was calculated by the automated system using pancytokeratin and set at 20 pixels. After cell segmentation, the following cells were phenotyped using the trainable software after select cells were manually assigned based on single staining criteria: T cells (CD3+), APCs (CD163+), ECs (pancytokeratin+), and other cells (CD3–CD163–pancytokeratin–). Fluorescent intensity scores of PD-L1, CD8, and FoxP3 were determined, which allowed for complex cell phenotyping using R (42). After the fluorescent intensity score was determined for PD-L1, CD8, and FoxP3, using R programs in combination with the original cell phenotypes produced by inForm (T cell, APC, EC, and other), complex phenotypes were formulated (Supplemental Table 5). Final multiplex fluorescent composite images were reviewed with a trained pathologist to confirm accuracy of staining and phenotyping. When calculating distances and engagement, some cells near the edges of the core were used, which represents a limitation of our methodology, but this strategy was consistently used across all images. Using R programs, the distance of a cell to its nearest neighbor and the number of cells engaged with other cells within a set radius were calculated.
Statistics.
All statistical analyses were performed using JMP Pro 13.2.0 unless stated otherwise. Differences in phenotype, distances, and engagement were evaluated by 2-tailed Student’s t test or ANOVA. For data not normally distributed, nonparametric Wilcoxon rank-sum was used. Categorical variables were analyzed with Fisher’s exact test, and P ≤ 0.05 was considered significant. P values were adjusted for multiple testing using the Benjamini-Hochberg false discovery rate procedure. Statistical significance was then assessed via an adjusted P value of 0.05. For survival analysis, Kaplan-Meier plots were drawn and statistical differences were determined by log-rank. Multivariate analysis of survival was performed using Cox regression for components that were statistically significant on univariate analysis and those previously associated with survival following resection of CRLM.
Study approval.
Collection of samples for this study and experiments performed were approved by the Institutional Review Board of Memorial Sloan Kettering Cancer Center.
Author contributions
JL acquired data, performed data analysis, and contributed to the manuscript. TM created R scripts, acquired data, performed data analysis, and contributed to the manuscript. JJS acquired data and performed data analysis. MPL performed data analysis and contributed to the manuscript. MID, WZ, and TLF formulated experimental design, performed data analysis, and interpreted results. LD, IK, HC, HN, and MPDM performed data analysis and interpreted results. AG acquired data and optimized antibodies. CS acquired data and optimized antibodies for use in staining. J. Shia created the TMA and analyzed of tissue samples to confirm tumor and lack of necrosis. J. Shi interpreted MMR protein staining and data analysis. IW acquired survival and patient data. AR provided statistical support and interpretation.
Supplementary Material
Acknowledgments
The authors wish to thank Edward Stack for his assistance with mfIHC optimization. Research reported in this publication was supported by the National Cancer Institutes (P30CA046592 and K08CA201581-01A1). The content is solely the responsibility of the authors and does not necessarily represent the official views of the National Institutes of Health.
Version 1. 11/15/2018
Electronic publication
Footnotes
Conflict of interest: The authors have declared that no conflict of interest exists.
License: Copyright 2018, American Society for Clinical Investigation.
Reference information: JCI Insight. 2018;3(22):e121932. https://doi.org/10.1172/jci.insight.121932.
Contributor Information
Tomasz Maj, Email: tomaszm@med.umich.edu.
J. Joshua Smith, Email: smithj5@mskcc.org.
Mirna Perusina Lanfranca, Email: mperusin@med.umich.edu.
Arvind Rao, Email: ukarvind@med.umich.edu.
Lawrence Delrosario, Email: jldelros@med.umich.edu.
Casey Schukow, Email: schukowc@gmail.com.
Jinru Shia, Email: shiaj@MSKCC.ORG.
Ilona Kryczek, Email: ilonak@med.umich.edu.
Jiaqi Shi, Email: jiaqis@umich.edu.
Isaac Wasserman, Email: isaac.wasserman@icahn.mssm.edu.
Hari Nathan, Email: drnathan@med.umich.edu.
Marina Pasca Di Magliano, Email: marinapa@umich.edu.
Weiping Zou, Email: wzou@umich.edu.
References
- 1.Pagès F, et al. Effector memory T cells, early metastasis, and survival in colorectal cancer. N Engl J Med. 2005;353(25):2654–2666. doi: 10.1056/NEJMoa051424. [DOI] [PubMed] [Google Scholar]
- 2.Galon J, Fridman WH, Pagès F. The adaptive immunologic microenvironment in colorectal cancer: a novel perspective. Cancer Res. 2007;67(5):1883–1886. doi: 10.1158/0008-5472.CAN-06-4806. [DOI] [PubMed] [Google Scholar]
- 3.Gout S, Huot J. Role of cancer microenvironment in metastasis: focus on colon cancer. Cancer Microenviron. 2008;1(1):69–83. doi: 10.1007/s12307-008-0007-2. [DOI] [PMC free article] [PubMed] [Google Scholar]
- 4.Katz SC, et al. Regulatory T cell infiltration predicts outcome following resection of colorectal cancer liver metastases. Ann Surg Oncol. 2013;20(3):946–955. doi: 10.1245/s10434-012-2668-9. [DOI] [PMC free article] [PubMed] [Google Scholar]
- 5.Fridman WH, Pagès F, Sautès-Fridman C, Galon J. The immune contexture in human tumours: impact on clinical outcome. Nat Rev Cancer. 2012;12(4):298–306. doi: 10.1038/nrc3245. [DOI] [PubMed] [Google Scholar]
- 6.Mahmoud SM, et al. Tumor-infiltrating CD8+ lymphocytes predict clinical outcome in breast cancer. J Clin Oncol. 2011;29(15):1949–1955. doi: 10.1200/JCO.2010.30.5037. [DOI] [PubMed] [Google Scholar]
- 7.Zhang YL, et al. Different subsets of tumor infiltrating lymphocytes correlate with NPC progression in different ways. Mol Cancer. 2010;9:4. doi: 10.1186/1476-4598-9-4. [DOI] [PMC free article] [PubMed] [Google Scholar]
- 8.Winerdal ME, et al. FOXP3 and survival in urinary bladder cancer. BJU Int. 2011;108(10):1672–1678. doi: 10.1111/j.1464-410X.2010.10020.x. [DOI] [PubMed] [Google Scholar]
- 9.Feng Z, et al. Multiparametric immune profiling in HPV- oral squamous cell cancer. JCI Insight. 2017;2(14):e93652. doi: 10.1172/jci.insight.93652. [DOI] [PMC free article] [PubMed] [Google Scholar]
- 10.Gajewski TF, Schreiber H, Fu YX. Innate and adaptive immune cells in the tumor microenvironment. Nat Immunol. 2013;14(10):1014–1022. doi: 10.1038/ni.2703. [DOI] [PMC free article] [PubMed] [Google Scholar]
- 11.Deschoolmeester V, Baay M, Lardon F, Pauwels P, Peeters M. Immune cells in colorectal cancer: prognostic relevance and role of MSI. Cancer Microenviron. 2011;4(3):377–392. doi: 10.1007/s12307-011-0068-5. [DOI] [PMC free article] [PubMed] [Google Scholar]
- 12.Llosa NJ, et al. The vigorous immune microenvironment of microsatellite instable colon cancer is balanced by multiple counter-inhibitory checkpoints. Cancer Discov. 2015;5(1):43–51. doi: 10.1158/2159-8290.CD-14-0863. [DOI] [PMC free article] [PubMed] [Google Scholar]
- 13.Le DT, et al. PD-1 Blockade in tumors with mismatch-repair deficiency. N Engl J Med. 2015;372(26):2509–2520. doi: 10.1056/NEJMoa1500596. [DOI] [PMC free article] [PubMed] [Google Scholar]
- 14.Le DT, et al. Mismatch repair deficiency predicts response of solid tumors to PD-1 blockade. Science. 2017;357(6349):409–413. doi: 10.1126/science.aan6733. [DOI] [PMC free article] [PubMed] [Google Scholar]
- 15.Lin H, et al. Host expression of PD-L1 determines efficacy of PD-L1 pathway blockade-mediated tumor regression. J Clin Invest. 2018;128(2):805–815. doi: 10.1172/JCI96113. [DOI] [PMC free article] [PubMed] [Google Scholar]
- 16.Qu QX, Huang Q, Shen Y, Zhu YB, Zhang XG. The increase of circulating PD-L1-expressing CD68(+) macrophage in ovarian cancer. Tumour Biol. 2016;37(4):5031–5037. doi: 10.1007/s13277-015-4066-y. [DOI] [PubMed] [Google Scholar]
- 17.Curiel TJ, et al. Blockade of B7-H1 improves myeloid dendritic cell-mediated antitumor immunity. Nat Med. 2003;9(5):562–567. doi: 10.1038/nm863. [DOI] [PubMed] [Google Scholar]
- 18.Francisco LM, et al. PD-L1 regulates the development, maintenance, and function of induced regulatory T cells. J Exp Med. 2009;206(13):3015–3029. doi: 10.1084/jem.20090847. [DOI] [PMC free article] [PubMed] [Google Scholar]
- 19.Taylor CR, Levenson RM. Quantification of immunohistochemistry--issues concerning methods, utility and semiquantitative assessment II. Histopathology. 2006;49(4):411–424. doi: 10.1111/j.1365-2559.2006.02513.x. [DOI] [PubMed] [Google Scholar]
- 20.Stack EC, Wang C, Roman KA, Hoyt CC. Multiplexed immunohistochemistry, imaging, and quantitation: a review, with an assessment of Tyramide signal amplification, multispectral imaging and multiplex analysis. Methods. 2014;70(1):46–58. doi: 10.1016/j.ymeth.2014.08.016. [DOI] [PubMed] [Google Scholar]
- 21.Carstens JL, et al. Spatial computation of intratumoral T cells correlates with survival of patients with pancreatic cancer. Nat Commun. 2017;8:15095. doi: 10.1038/ncomms15095. [DOI] [PMC free article] [PubMed] [Google Scholar]
- 22.Nagl S, et al. Cell-to-cell distances between tumor-infiltrating inflammatory cells have the potential to distinguish functionally active from suppressed inflammatory cells. Oncoimmunology. 2016;5(5):e1127494. doi: 10.1080/2162402X.2015.1127494. [DOI] [PMC free article] [PubMed] [Google Scholar]
- 23.Curiel TJ, et al. Specific recruitment of regulatory T cells in ovarian carcinoma fosters immune privilege and predicts reduced survival. Nat Med. 2004;10(9):942–949. doi: 10.1038/nm1093. [DOI] [PubMed] [Google Scholar]
- 24.Maby P, Galon J, Latouche JB. Frameshift mutations, neoantigens and tumor-specific CD8(+) T cells in microsatellite unstable colorectal cancers. Oncoimmunology. 2016;5(5):e1115943. doi: 10.1080/2162402X.2015.1115943. [DOI] [PMC free article] [PubMed] [Google Scholar]
- 25.Katz SC, et al. T cell infiltrate predicts long-term survival following resection of colorectal cancer liver metastases. Ann Surg Oncol. 2009;16(9):2524–2530. doi: 10.1245/s10434-009-0585-3. [DOI] [PubMed] [Google Scholar]
- 26.Mlecnik B, et al. Histopathologic-based prognostic factors of colorectal cancers are associated with the state of the local immune reaction. J Clin Oncol. 2011;29(6):610–618. doi: 10.1200/JCO.2010.30.5425. [DOI] [PubMed] [Google Scholar]
- 27.Cavnar MJ, et al. Tumor-associated macrophage infiltration in colorectal cancer liver metastases is associated with better outcome. Ann Surg Oncol. 2017;24(7):1835–1842. doi: 10.1245/s10434-017-5812-8. [DOI] [PMC free article] [PubMed] [Google Scholar]
- 28.Galon J, et al. Type, density, and location of immune cells within human colorectal tumors predict clinical outcome. Science. 2006;313(5795):1960–1964. doi: 10.1126/science.1129139. [DOI] [PubMed] [Google Scholar]
- 29.Reissfelder C, et al. Tumor-specific cytotoxic T lymphocyte activity determines colorectal cancer patient prognosis. J Clin Invest. 2015;125(2):739–751. doi: 10.1172/JCI74894. [DOI] [PMC free article] [PubMed] [Google Scholar]
- 30.Tosolini M, et al. Clinical impact of different classes of infiltrating T cytotoxic and helper cells (Th1, th2, treg, th17) in patients with colorectal cancer. Cancer Res. 2011;71(4):1263–1271. doi: 10.1158/0008-5472.CAN-10-2907. [DOI] [PubMed] [Google Scholar]
- 31.Zou W, Wolchok JD, Chen L. PD-L1 (B7-H1) and PD-1 pathway blockade for cancer therapy: Mechanisms, response biomarkers, and combinations. Sci Transl Med. 2016;8(328):328rv4. doi: 10.1126/scitranslmed.aad7118. [DOI] [PMC free article] [PubMed] [Google Scholar]
- 32.Frey DM, et al. High frequency of tumor-infiltrating FOXP3(+) regulatory T cells predicts improved survival in mismatch repair-proficient colorectal cancer patients. Int J Cancer. 2010;126(11):2635–2643. doi: 10.1002/ijc.24989. [DOI] [PubMed] [Google Scholar]
- 33.Salama P, et al. Tumor-infiltrating FOXP3+ T regulatory cells show strong prognostic significance in colorectal cancer. J Clin Oncol. 2009;27(2):186–192. doi: 10.1200/JCO.2008.18.7229. [DOI] [PubMed] [Google Scholar]
- 34.Zaritskaya L, Shurin MR, Sayers TJ, Malyguine AM. New flow cytometric assays for monitoring cell-mediated cytotoxicity. Expert Rev Vaccines. 2010;9(6):601–616. doi: 10.1586/erv.10.49. [DOI] [PMC free article] [PubMed] [Google Scholar]
- 35.Keir ME, et al. Tissue expression of PD-L1 mediates peripheral T cell tolerance. J Exp Med. 2006;203(4):883–895. doi: 10.1084/jem.20051776. [DOI] [PMC free article] [PubMed] [Google Scholar]
- 36.Taube JM, et al. Colocalization of inflammatory response with B7-h1 expression in human melanocytic lesions supports an adaptive resistance mechanism of immune escape. Sci Transl Med. 2012;4(127):127ra37. doi: 10.1126/scitranslmed.3003689. [DOI] [PMC free article] [PubMed] [Google Scholar]
- 37.Liu Y, Zeng B, Zhang Z, Zhang Y, Yang R. B7-H1 on myeloid-derived suppressor cells in immune suppression by a mouse model of ovarian cancer. Clin Immunol. 2008;129(3):471–481. doi: 10.1016/j.clim.2008.07.030. [DOI] [PubMed] [Google Scholar]
- 38.Topalian SL, et al. Safety, activity, and immune correlates of anti-PD-1 antibody in cancer. N Engl J Med. 2012;366(26):2443–2454. doi: 10.1056/NEJMoa1200690. [DOI] [PMC free article] [PubMed] [Google Scholar]
- 39.Brahmer JR, et al. Safety and activity of anti-PD-L1 antibody in patients with advanced cancer. N Engl J Med. 2012;366(26):2455–2465. doi: 10.1056/NEJMoa1200694. [DOI] [PMC free article] [PubMed] [Google Scholar]
- 40.Topalian SL, et al. Survival, durable tumor remission, and long-term safety in patients with advanced melanoma receiving nivolumab. J Clin Oncol. 2014;32(10):1020–1030. doi: 10.1200/JCO.2013.53.0105. [DOI] [PMC free article] [PubMed] [Google Scholar]
- 41.Kim CG, et al. Effects of microsatellite instability on recurrence patterns and outcomes in colorectal cancers. Br J Cancer. 2016;115(1):25–33. doi: 10.1038/bjc.2016.161. [DOI] [PMC free article] [PubMed] [Google Scholar]
- 42. R Core Team. R: A language and environment for statistical computing. R Foundation for Statistical Computing, Vienna, Austria. https://www.r-project.org/ Accessed November 5, 2018.
Associated Data
This section collects any data citations, data availability statements, or supplementary materials included in this article.


