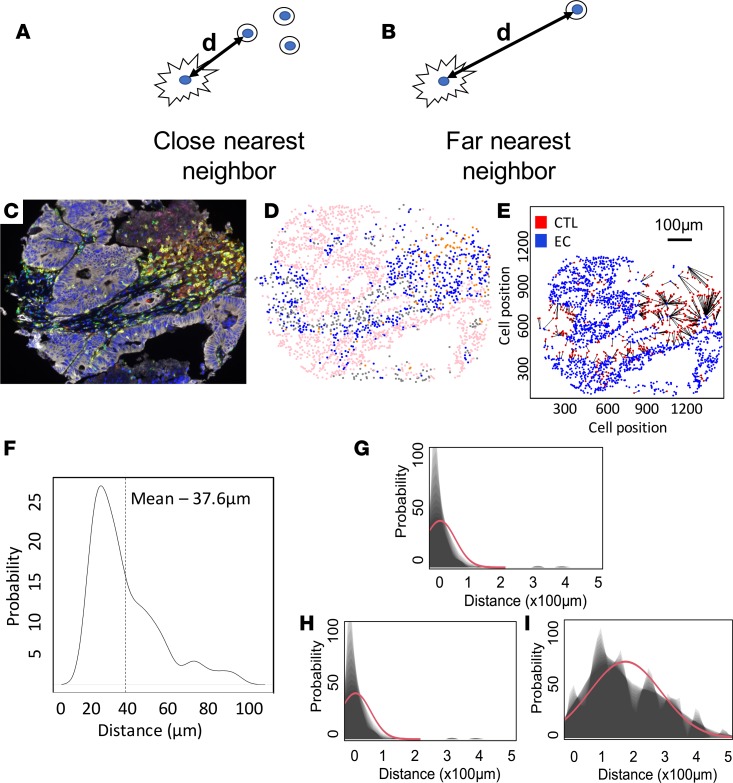
Figure 3. PD-L1 expression on epithelial cells is associated with greater distance to cytotoxic T lymphocytes.
(A and B) Schematic representation of close and far nearest neighboring cell, with d representing distance in microns. (C–E) After multiplex fluorescent immunohistochemistry (mfIHC; original magnification, ×20), cells were phenotyped and assigned coordinates. (E) Distances between individual cytotoxic T lymphocytes (CTLs) and epithelial cells (ECs) were recorded for all imaged cores (n = 177 patients). (F) A weighted mean distance was calculated for all cells utilizing all available cores per patient. (G–I) Spatial relationship between CTLs and (G) total ECs, (H) PD-L1– ECs, and (I) PD-L1+ APCs for all patients in the cohort.

