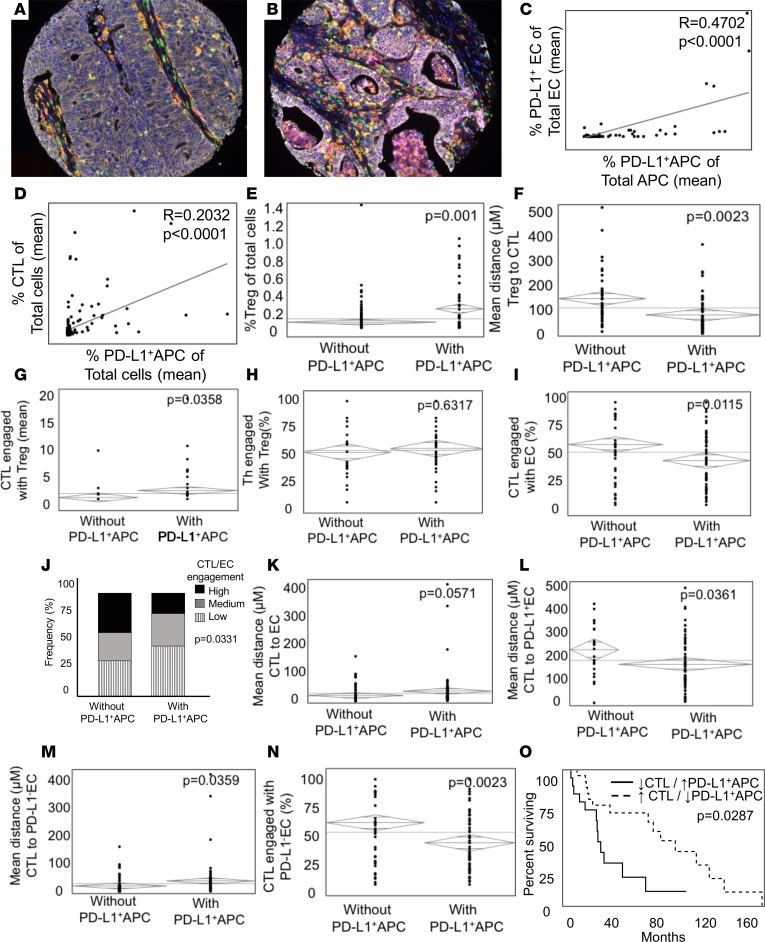
Figure 5. Infiltration of PD-L1+antigen-presenting cells shapes the immune microenvironment of colorectal liver metastases.
(A and B) Representative multiplex images (original magnification, ×20) (white, epithelial cell [EC]; green, helper T cell; yellow, cytotoxic T lymphocyte [CTL]; red, Treg; orange, antigen-presenting cell [APC]; magenta, PD-L1) of colorectal liver metastases (CRLM) with (A) low and (B) high infiltration of PD-L1+ APCs (coexpressing orange [CD163] and magenta [PD-L1]). (C and D) Correlation analysis between (C) PD-L1+ EC and PD-L1+ APCs and (D) CTLs and PD-L1+ APCs. Pearson correlation coefficient and P values are shown for each pair. (E–I) ANOVA comparing patients with (n = 72) and without (n = 80) infiltrating PD-L1+ APCs relative to (E) Treg infiltration, (F) distance from Tregs to CTLs, (G) engagement of Tregs and CTLs with ECs, (H) engagement of Tregs with helper T cells, and (I) engagement of Tregs with CTLs. (J) Patient CTL/EC engagement was categorized by terciles and compared with PD-L1+ APC infiltration. (K–O) ANOVA was used to compare patients with or without PD-L1+ APCs relative to (K) distance from CTLs to ECs, (L) mean distance from CTLs to PD-L1+ ECs, (M) mean distance from CTLs to PD-L1– ECs, and (N) engagement of CTLs with PD-L1– ECs. (O) Kaplan-Meier survival curve for patient with infiltration of numerous (upper quartile) CTLs and few (lowest quartile) PD-L1+ APCs (n = 16) compared with those with few CTLs (lowest quartile) and numerous PD-L1+ APCs (highest quartile) (n = 13).

