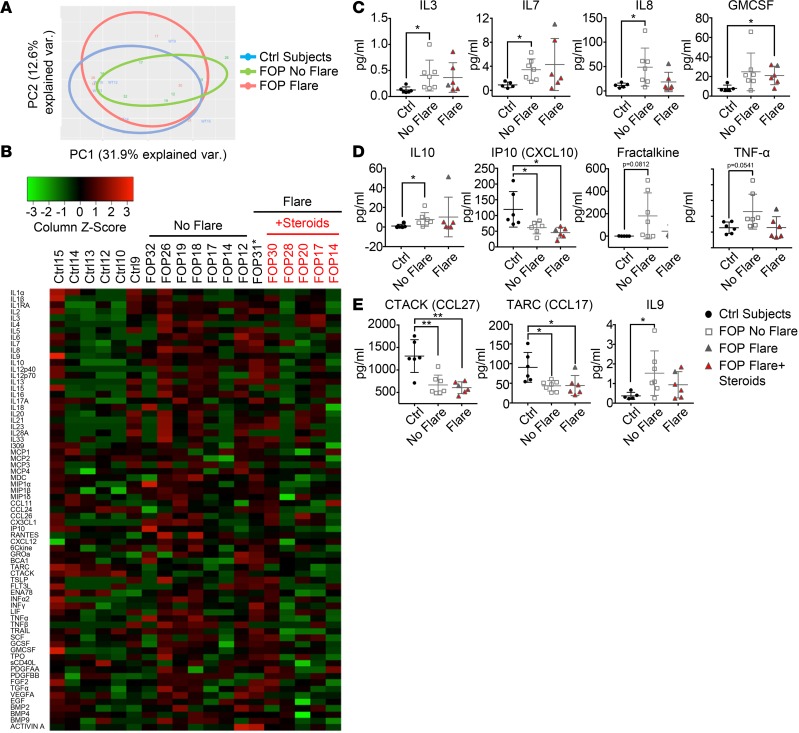
Figure 2. Sera of FOP patients show elevated proinflammatory cytokines.
Multiplex assays for 69 cytokines on serum of control (n = 6), FOP subjects with clinical documented flare (n = 6), and FOP subjects without a flare (n = 7). (A) Principle component analysis of the 69 cytokines. (B) Heatmap representing color-coded cytokines/chemokines detected in the serum of control and FOP subjects, showing that FOP patients without a flare tend to show increased cytokine levels. Asterisk indicates that FOP31 was not taking steroids at the time of collection. (C and D) Myeloid and proinflammatory cytokine were significantly increased in FOP subjects with no flare. (E) Lymphoid cytokines CTACK (cutaneous T cell–attracting chemokine) and TARC (thymus and activation–regulated chemokine) were significantly lower in all FOP subjects. IL-9, which can be secreted by lymphocytes and mast cells, was elevated in FOP subjects with no flare. The distribution of the subjects is described in Supplemental Table 1. Error bars represent mean ± 1 SD. *P < 0.05, **P < 0.01, by Student’s t test.

