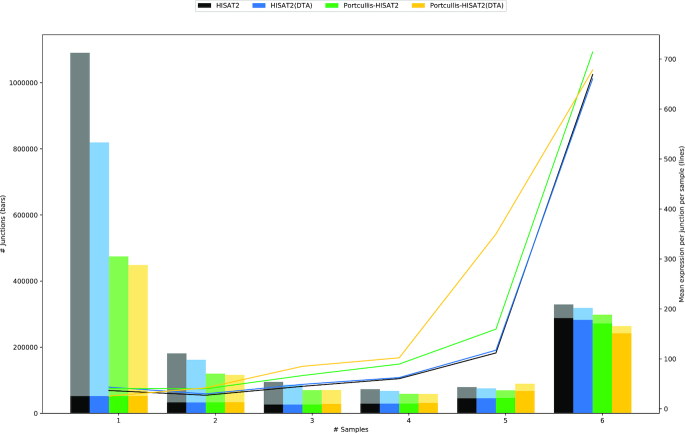
Figure 7.
Junction counts that are supported by one through six samples for wheat RNA-seq data. Solid tint indicates that junctions were found in the reference annotation; paler tint indicates junctions were not found in the reference. Junctions that occur in all six samples are more likely to be found in the reference. Average expression per junction per sample is shown by the lines and indicates that junctions found in all samples have high expression.

