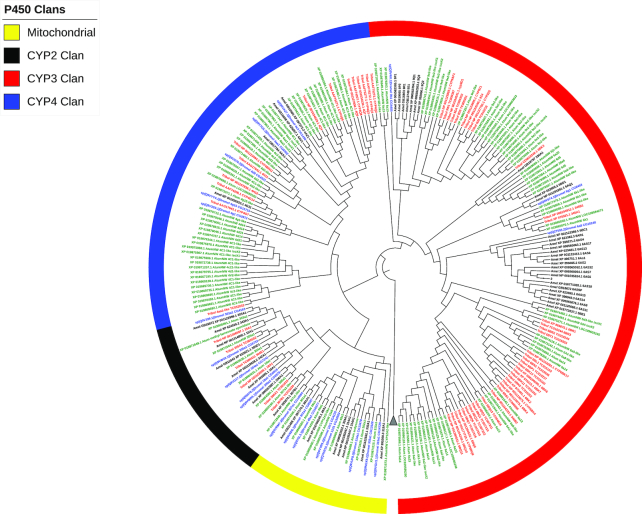
Figure 8:
Maximum likelihood phylogenetic tree of the cytochrome P450 detoxification system. The bootstrap consensus tree inferred from 1,000 replicates is taken to represent the evolutionary history of the taxa A. tumida (ATUMI) in green, A. mellifera (AMELL) in black, D. melanogaster (DMELA) in blue, and T. castaneum (TCAST) in red, identified manually using the Uniprot and Pfam databases. Branches corresponding to partitions reproduced in less than 50% bootstrap replicates are collapsed. Initial tree(s) for the heuristic search was obtained automatically by applying Neighbor-Join and BioNJ algorithms to a matrix of pairwise distances estimated using a JTT model and then selecting the topology with superior log likelihood value. All positions with less than 95% site coverage were eliminated. P450s are clustered to CYP2, CYP3, CYP4, and mitochondrial clans. The tree was annotated and visualized with the iToL web tool (itol.embl.de/) [58].

