Figure 5.
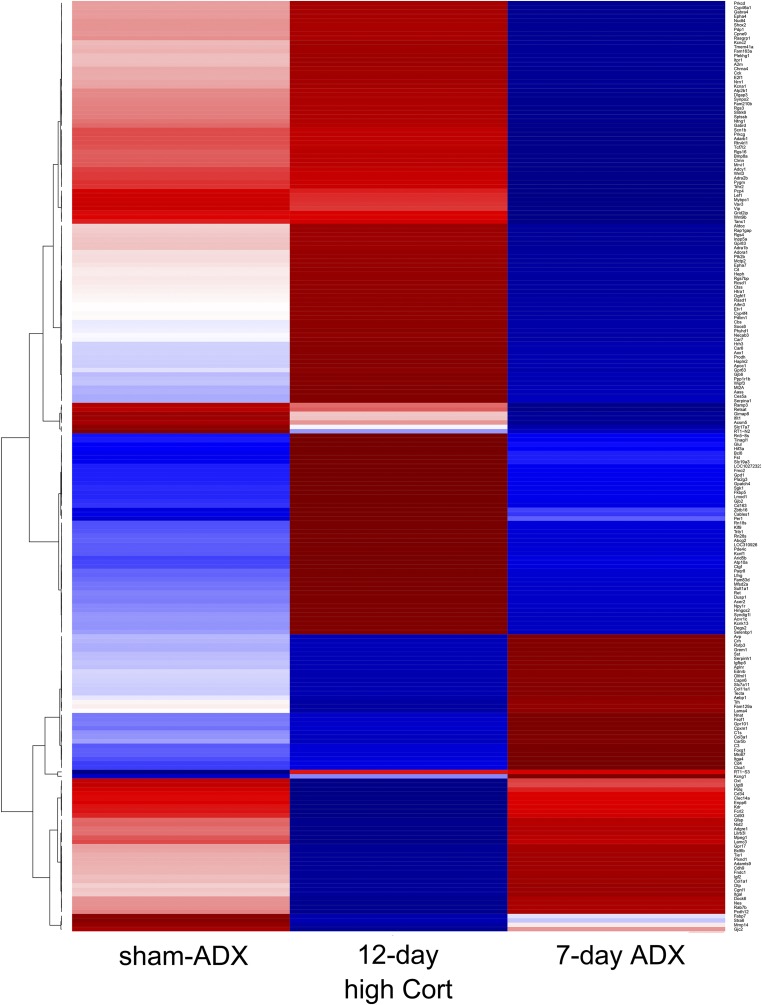
The clustering analysis of the profiles of transcripts in experiment 1. A hierarchical clustering analysis (correlation/ward D2) was done for the transcripts identified in experiment 1, and they are presented as a heatmap. The mean values of duplicate RNA-seq data for each experimental group were used. Most transcripts upregulated in the 12-day high Cort group were downregulated in the 7-day ADX group and vice versa, but there were a limited number of genes that responded unidirectionally, either to the 12-day high Cort or to the 7-day ADX. Note that the number of genes presented in the heatmap is greater than that shown in Venn diagrams in Fig. 4a and 4b and Supplemental Tables 1–4 because cluster analysis was done for the genes whose expression was significantly different between any two groups out of the three experimental groups (i.e., sham-ADX, 12-day high Cort, and 7-day ADX).

