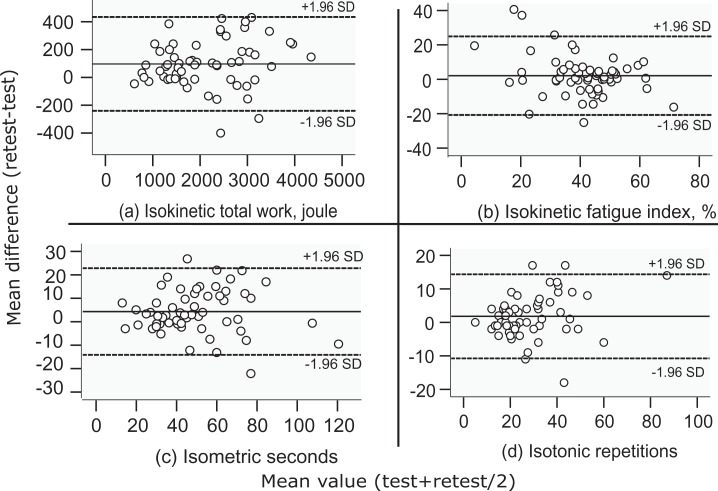
Figure 2.
Bland–Altman plots of individual variation between test–retest measurements using the original data for isokinetic total work in joule (a), isokinetic fatigue index calculated as the ratio of the decline in work during the last 10 repetitions to the first 10 repetitions of the total 30 maximal isokinetic repetitions (b), isometric time in seconds to exhaustion above 50% of MVC (c), and isotonic repetitions to exhaustion at 30% of MVC (d) measurement results. Mean values of the test and retest measurements are displayed on the x-axis and the difference between retest and test on the y-axis (positive values indicates a higher result on retest). Reference lines at the mean difference and LoA (mean difference ± 1.96 SD of the mean difference). MVC: maximal voluntary contraction; LoA: limits of agreement; SD: standard deviation.

