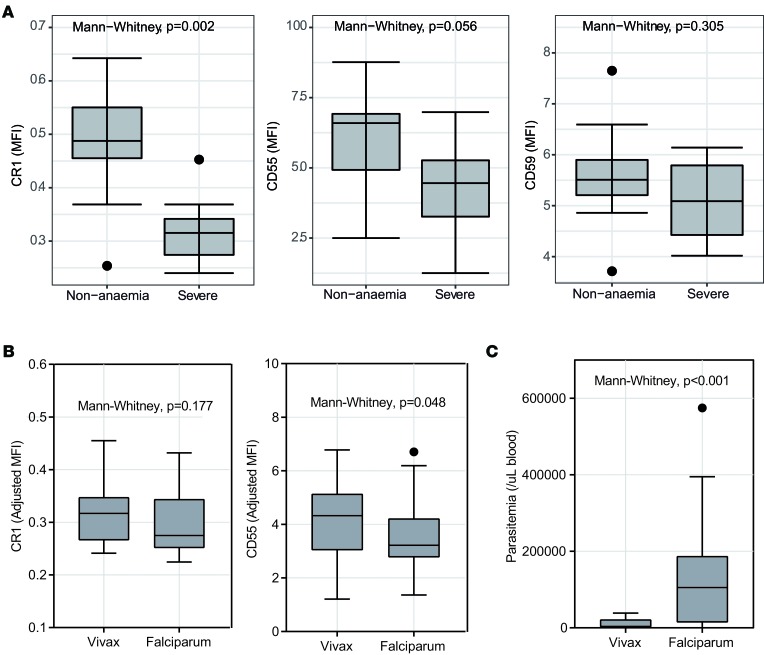
Figure 2. Levels of CRPs on uninfected RBCs surfaces from P.
vivax–infected patients in comparison withP.falciparum–infected patients. (A) Level of complement regulatory proteins (CRPs) on uninfected RBC surfaces from P. vivax–infected patients. Expression of CR1, CD55, and CD59 was compared between 3 among anemia statuses (nonanemia, n = 10; severe anemia, n = 12). (B) Comparison of CR1 and CD55 expression on uninfected RBCs between P. vivax (n = 12) and P. falciparum (n = 30) patients with severe anemia. (C) Comparison of parasite biomass (parasite/μl of blood) between P. vivax (n = 13) and P. falciparum (n = 30) patients with severe anemia. Mann-Whitney nonparametric test between groups is indicated. Lower and upper hinges represent first and third quartiles, and whisker lines correspond to highest and lowest values no further than 1.5 interquartile range from the hinges. Data beyond the whisker lines are treated as outliers. Median line is indicated across the box.

