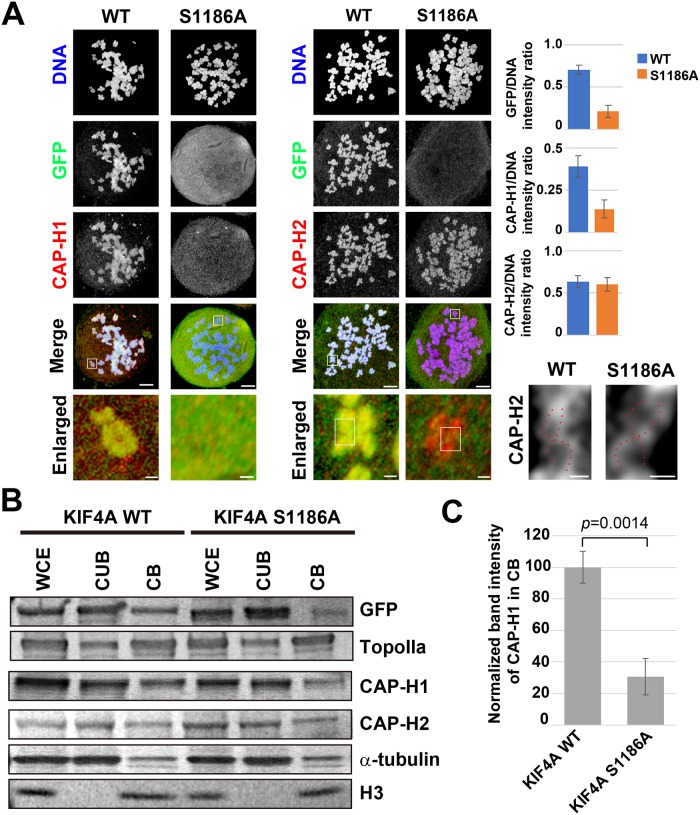
Fig 3. Effects of the loss of KIF4A phosphorylation at S1186 on the chromosome scaffold.
(A) Localization of EGFP-KIF4A and condensin subunits. Chromosome spreads were prepared from mitotic cells expressing EGFP-KIF4A WT or S1186A. Endogenous KIF4A was depleted by RNAi. EGFP-KIF4A (green), and a condensin I subunit CAP-H1 (red) and a condensin II subunit CAP-H2 (red) were detected by immunostaining. DNA was counterstained with Hoechst 33342 (blue). Fluorescent signals were observed by confocal microscopy. Bottom panels show enlarged images of chromosomes in white boxes without DNA signals. The localization of CAP-H2 in the white box in enlarged images was further magnified and the image contrast was changed to clarify the scaffold structure. DCS was observed in both KIF4A WT and KIF4A S1186A-expressing cells (red broken line). Bar graphs show the signal intensity ration of GFP, CAP-H1 and CAPH-2 on chromosomes vs. DNA (n = 20). Bars, 5 μm in whole cell images, 300 nm in enlarged images, and 150 nm in DCS images. (B) The amounts of chromosome scaffold proteins in EGFP-KIF4A WT- or S1186A- expressing cells. Mitotic cells were fractionated into the chromatin-unbound fraction (CUB) and the chromatin-binding fraction (CB). Whole cell extracts (WCE) were also analyzed. The amounts of the chromosome scaffold proteins GFP-KIF4A, topoisomerase IIα (TopoIIα), CAP-H1, and CAP-H2 were estimated by WB analysis. Alpha-tubulin and histone H3 were also detected as cytoplasmic protein and chromatin protein controls, respectively. This panel is organized from three membranes and all blots were shown in S3 Fig. (C) The band intensity of CAP-H1 in the CB was normalized and compared between the EGFP-KIF4A WT- and S1186A-expressing cells (n = 3).

