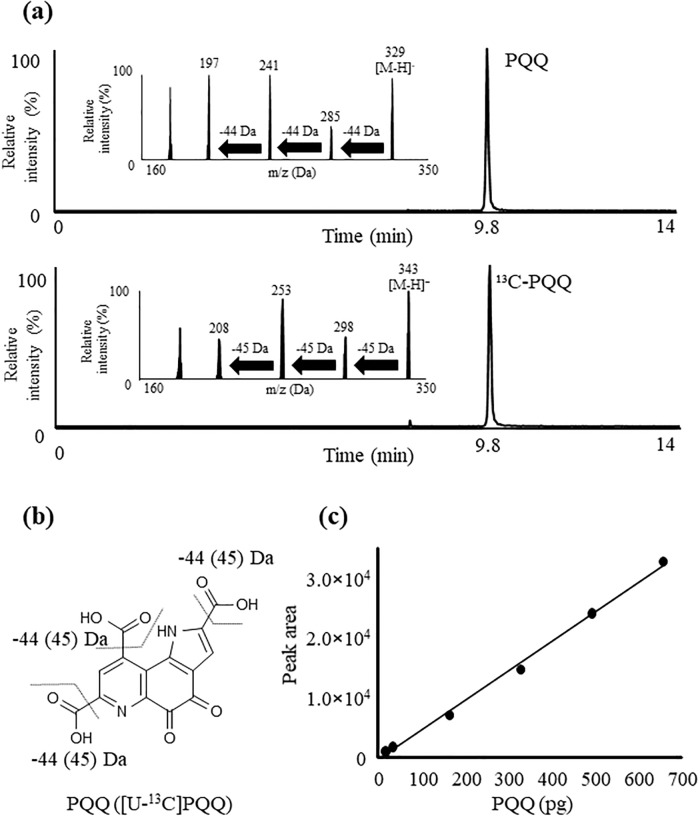
Fig 3.
(a) Product ion mass spectrum and ESI chromatograms of PQQ and 13C-PQQ. PQQ and 13C-PQQ standards (10 μM in 30% (v/v) acetonitrile/10 mM DBAA aqueous solution) were each infused directly into the MS/MS apparatus at a flow rate of 5 μL/min. A mixture of standards (2 pmol each) was analyzed by LC-MS/MS. (b) The proposed fragmentation pattern of PQQ and [U-13]C-PQQ. (c) Calibration curve of PQQ by LC-MS/MS. Different amounts of PQQ (15–650 ng) were analyzed in the ESI mode. Detailed analytical procedures are described in Materials and methods section.

