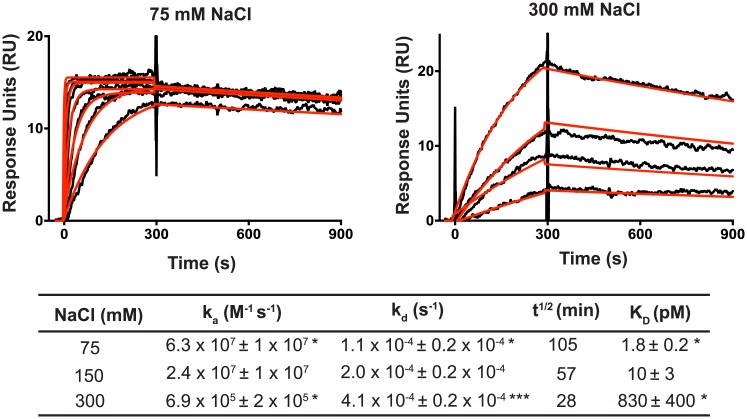
Fig 4. Effect of salt concentration on the kinetics of PPR10-atpH RNA interactions.
Representative sensorgrams are shown at top. PPR10 was used at 5 nM and two-fold dilutions thereof. The data (black) were fit with a 1:1 Langmuir binding model (red). Residuals are shown in S2C Fig. The table below shows the binding parameters inferred from the data (average of three replicate experiments +/- standard error). Values that show a significant difference from those at 150 mM NaCl (see Fig 3A) are indicated (* = P<0.05, *** = P<0.001, according to a students t-test).

