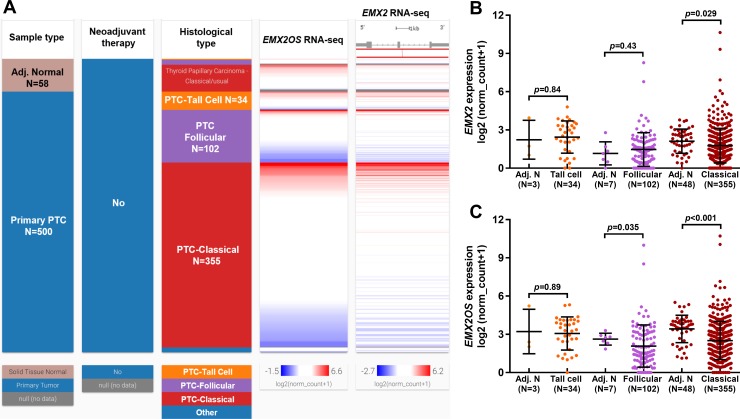
Fig 1. The expression profile of EMX2 and EMX2OS in each variant of PTC compared and their adjacent normal tissues.
A-C. Heatmap (A) and plots chart (B-C) showing the expression profile of EMX2 (B) and EMX2OS (C) in each variant of PTC compared and their adjacent normal tissues. The number of tumor tissues and adjacent normal tissues were as indicated.

