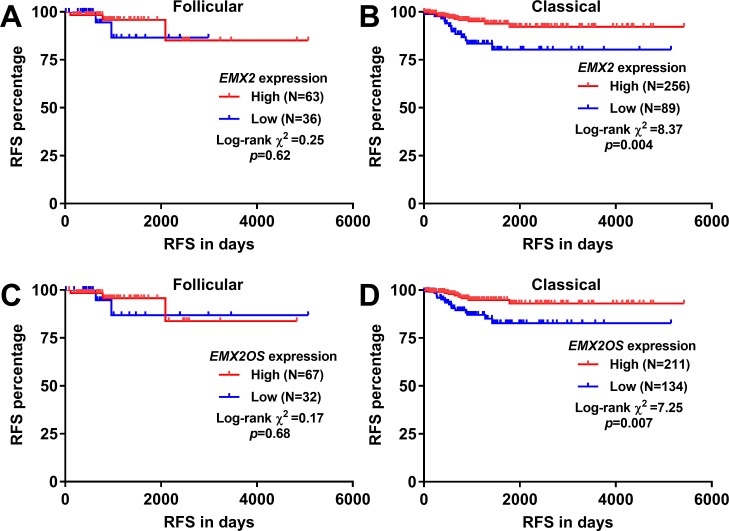
Fig 2. Decreased EMX2 and EMX2OS expression was associated with unfavorable RFS in classical PTC, but not in follicular PTC.
A-D. Kaplan-Meier curves of RFS in follicular (A and C) and classical (B and D) PTC. Patients were grouped according to the best cutoff of EMX2 (A-B) and EMX2OS (C-D) expression in the ROC analysis for recurrence detection.

