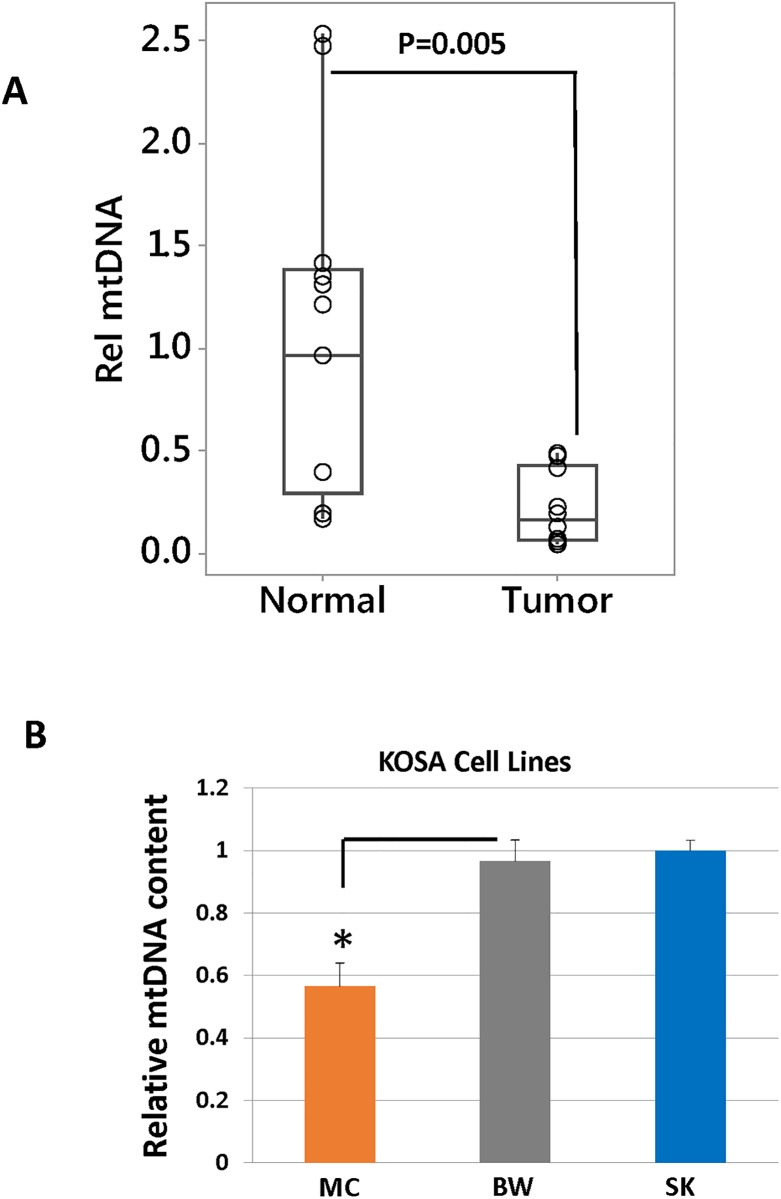
Fig 1. Differences in mtDNA content in OSA cell lines and tissue samples.
Real time PCR showing relative mtDNA levels in (A) OSA tumor tissues (n = 10) and matched non-tumor tissues (n = 10), (B) MtDNA estimation in OSA cell lines using real time PCR. The mtDNA content (y-axis) is quantified from total DNA as the copy number of mtDNA gene CcO1, normalized to the copy number of nuclear single copy gene CcOIVi1.

