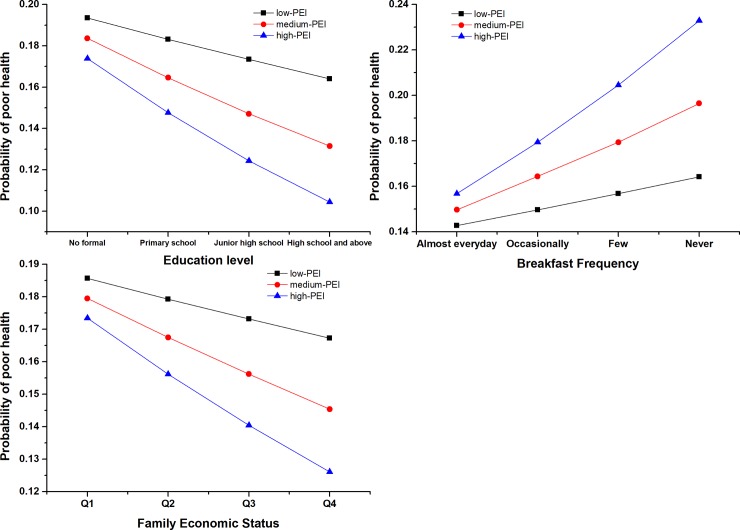
Fig 1. Interaction effects of PEI and education level, Breakfast frequency, and Family economic status among Chinese greenhouse vegetable farmers.
Abbreviation: PEI: Pesticides Exposure Intensity (3-levels: Low, Medium, and High). Notes: The Y-axis is Probability of poor health calculated through logistic regression in which the dependent variable was SRH status (Poor = 2 and Excellent = 1) and the independent variables were each original variable used to derive the respective interaction variable. For example: in the left figure, the independent variables were education level and PEI; in the middle figure, the independent variables were Breakfast Frequency and PEI; in the right figure, the independent variables were Family economic status and PEI. Q1: First quartile of Family economic status; Q2: Second quartile of Family economic status; Q3: Third quartile of Family economic status; Q4: Fourth quartile of Family economic status.

