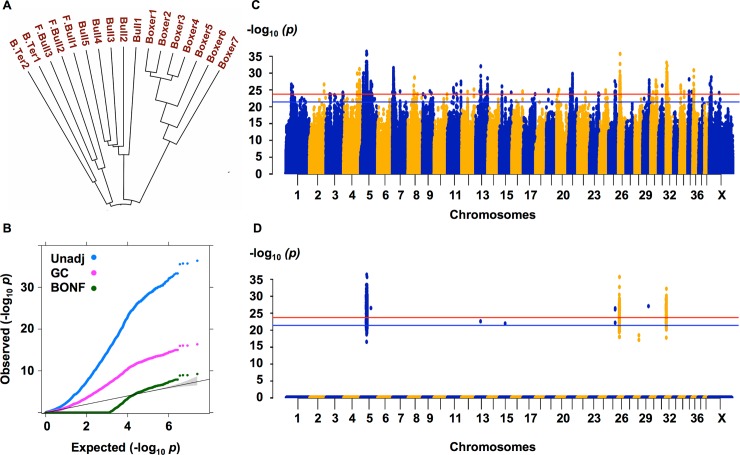
Fig 2. Across breed genome-wide association for screw tail.
(A) Hierarchical clustering of Identity by state distance of screw tail breeds. (B) QQ plot of–log 10 of p values before (Unadj) and after genomic (GC) and statistical correction (BONF). (C) and (D) Manhattan plots with–log 10 of p values on y axis and chromosome on the x axis with horizontal blue and red lines indicating p values of 0.05 and 0.01 after correction showing all tested genotypes (C) or 90% allelic difference (D).

