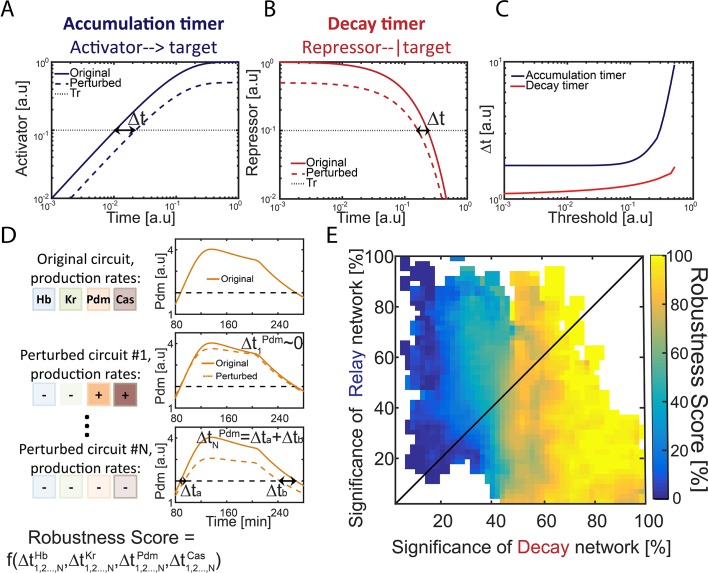
Figure 2. Repressor-decay timer is more robust than an activator-relay timer.
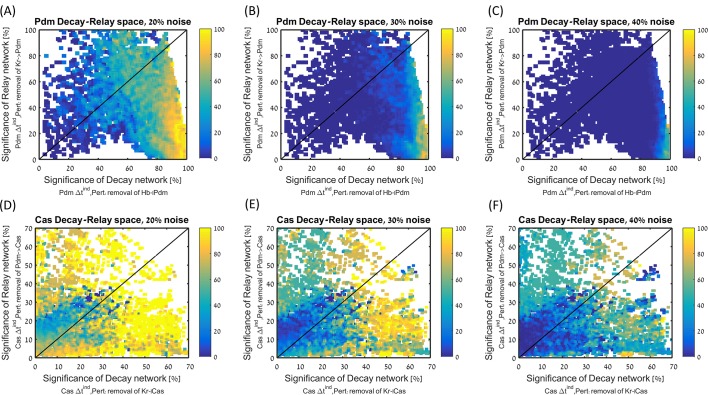
(A–C) Robustness of single-step timers: a single-step timer can be implemented by the accumulation of an activator (A) or by the decay of a repressor (B). In the accumulation of an activator scenario (A), activator production is initiated at t = 0. Once it accedes the threshold Tr, target genes are induced. In the decay of a repressor scenario (B), production of a repressor is stopped at t = 0. Once repressor levels have decayed below Tr, target genes would no longer be inhibited. The temporal dynamics of the regulatory proteins are shown in (A–B) for reference parameters (solid line) and following two-fold reduction in regulator production rate (dashed line). Timer output is defined by the time-delay from the onset of the dynamics until the regulator reaches the indicated threshold Tr. The change in this output following two-fold change in production rate is indicated (black double arrow), and is shown in (C) for different threshold values. See also analytical analysis in (Rappaport et al., 2005). (D) Illustration of robustness score calculation. Parameter sets were scored for robustness by measuring timer sensitivity to moderate (20%) variations in production parameters (see Materials and methods). When testing set robustness, we solved model equations for all combinatorial combinations of adding or subtracting 20% to all the TTFs production rates. For each noise combination, we compared all TTF expression phase durations to those of the original set solution. If a noise combination yielded phase durations which are all within 10% distance of the respective original durations, the noise combination was considered 'close' to the original. A robustness score was then calculated as the percentage of 'close' noise combinations. An example for a specific parameter set: left- production rates color coded by TTF, right – simulation of Pdm dynamics. Upper: original parameter set, below: two noise combinations:#1 and #N (- sign and lighter shade for reduced production rate, + sign and darker shade for increased production rate). For #1, the perturbed dynamics are 'close' to the original while for #N, a substantial error in phase duration, Δ, occurred and dynamics are not 'close'. Formula at the bottom of the panel indicates that the robustness score for the original set is a function of all noise combinations 1,2,…,N and durations of all TTF expression phases. (E) Distribution of robust circuits in the Decay-Relay timer space. Consistent circuits were positioned on the Decay-Relay plot based on both Pdm and Cas induction, as is Figure 1H, and their robustness scores (see Materials and methods), averaged over closely positioned circuits, were color-coded. Considering the positioning of all circuits in the Decay-Relay timer space based on Pdm and Cas separately (Figure 2—figure supplement 1) and based on both TTFs combined (Figure 2E), high robustness scores were found in the region of repressor-decay timers.


