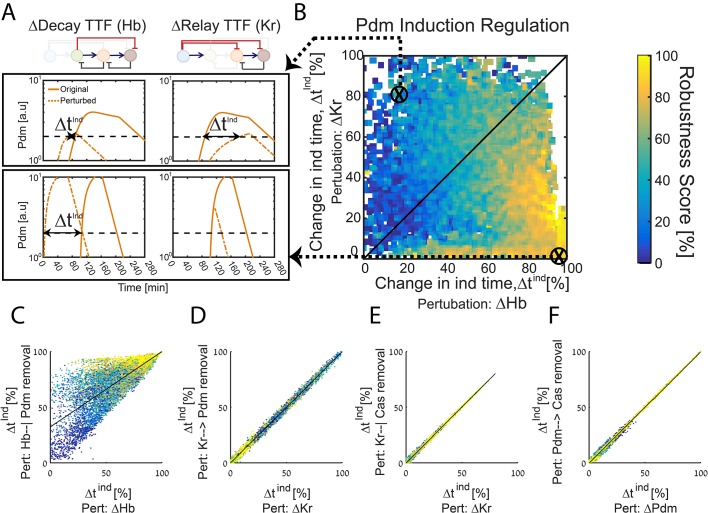
Figure 3. The TTF circuit can be positioned in the Decay-Relay timer space based on TTF deletion phenotypes.
(A–B) TTF deletion phenotypes can distinguish robust circuits: all consistent circuits, as described in Figures 1–2 above, were considered. Each consistent circuit was scored by measuring the change in Pdm induction times following deletion of Hb (A, left) or deletion of Kr (A, right). These two values define the ‘Hb deletion’ and ‘Kr deletion’ sensitivity of Pdm induction respectively, for each parameter set. We then use these two values to define the Hb-Kr deletion sensitivity space, where we uniquely position each consistent circuit (B). Color-coding circuits based on their robustness score for the WT circuit (as in Figure 2E), allows us to observe robustness of WT circuits as function of their Pdm induction sensitivity to Hb and Kr deletions. This analysis shows that robust circuits are only found in a small region in the Kr-Hb sensitivity space, in which Pdm induction time is much more sensitive to Hb than to Kr deletion. (C–F) Sensitivity to TTF deletion (X axis) correlates with the sensitivity to the specific removal of the respective activator-relay or repressor-decay interactions (Y axis): all consistent circuits, as described in Figures 1–2 above, were considered. For each consistent circuit, the changes in Pdm or Cas induction times following TTF deletion or removal of regulatory interactions was measured. Correlations between the effects of TTF deletion and removal of the respective regulatory link are shown. Each dot in these correlation figures represent one consistent circuit, color-coded by its robustness score for the WT circuit.


