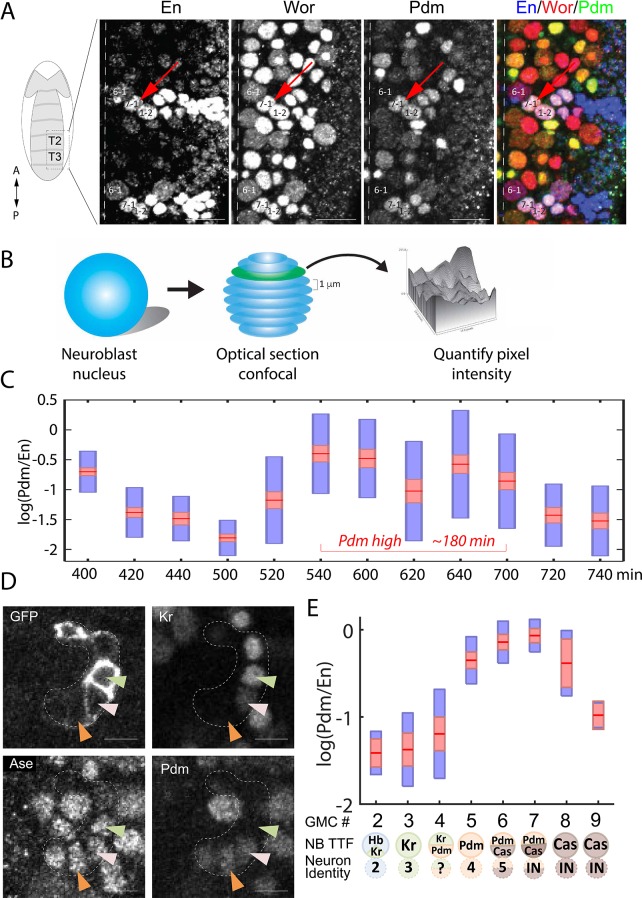
Figure 4. High temporal resolution analysis of Pdm expression.
(A) Confocal image of the neuroblast layer from ventral nerve cord segments T2 and T3 of an early stage 11 embryo (boxed area in illustrated embryo on the left). The NB7-1 was identified by the pan-NB marker Worniu (Wor) and the NB spatial marker Engrailed (En). NB6-1 is the most anterior medial En +NB, with the En +NB7-1 just posterior and lateral (red arrow), and En +NB1-2 completing the diagonal. Genotype: y1 w1. Scale bar: 20 um. (B) Methodology for obtaining transcription factor levels in G1/G2/S-phase of NB7-1. Confocal section stacks (at a 1 um interval) of individual NB nuclei were obtained, and the area and signal intensity of each section were measured and summed to obtain the total intensity of TTFs. (C) Data from the number of NB7-1 indicated in Supplementary file 3 is summarized by box plots of measured log(Pdm/En) staining intensity as a function of time. The 1.96 SEM (95% confidence interval) is shown as a red rectangle with a horizontal red line for the mean, with a blue rectangle marking the limits of one standard deviation above and below the mean. Time duration of the Pdm phase (approximately 180 min) is indicated in red. We do not yet have an explanation for the moderate transient decrease in Pdm levels around 620 min. (D) Confocal image of a NB7-1 lineage marked with GFP (NB7-1-Gal4, UAS-GFP) in an early stage 11 embryo. Arrowheads indicate three consecutive GMCs (Ase+) which are Kr+Pdm- (green), Kr+Pdm+ (pink), and Kr-Pdm+ (orange). Genotype: ac-VP16AD gsb-Gal4DBD UAS-superfoldGFP. Scale bar: 5 um. (E) Data from the number of NB7-1 indicated in Supplementary file 3 is summarized by box plots of measured log(Pdm/En) staining intensity as a function of the number of progeny GMC. The 1.96 SEM (95% confidence interval) is shows in red rectangle with a horizontal red line for the mean, one standard deviation above and below the mean in blue rectangle. Scheme below the X axis shows which neuronal progeny is hypothesized to be derived from the GMC.
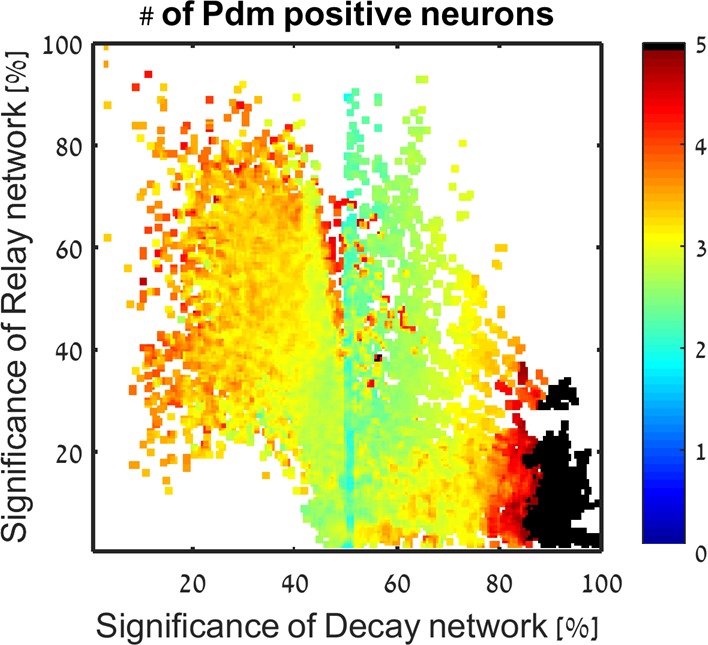
Figure 4—figure supplement 1. In color: the number of Pdm positive neurons predicted to be created for each consistent parameter set, averaged over close parameter sets.


