. 2018 Dec 14;7:e40690. doi: 10.7554/eLife.40690

Figure 2. Biorientation inhibition requires BUB-1 localisation at the kinetochore.

(A) Schematics of WT KNL-1 and of the ∆85–505 mutant that leads to loss of BUB-1 from kinetochores. (B) Kymographs generated from embryos expressing GFP::γ-Tub and KNL-1::mCherry, for the indicated conditions. (C) Chromosome span and pole to pole distance as functions of time after NEBD for the indicated conditions. (D) Quantification of the percentage of embryos with chromosomes engaged in amphitelic, merotelic and mono-oriented attachments in the indicated conditions. Error bars represent the SEM. Horizontal scale bar, 5 μm; Vertical scale bar, 20 s.

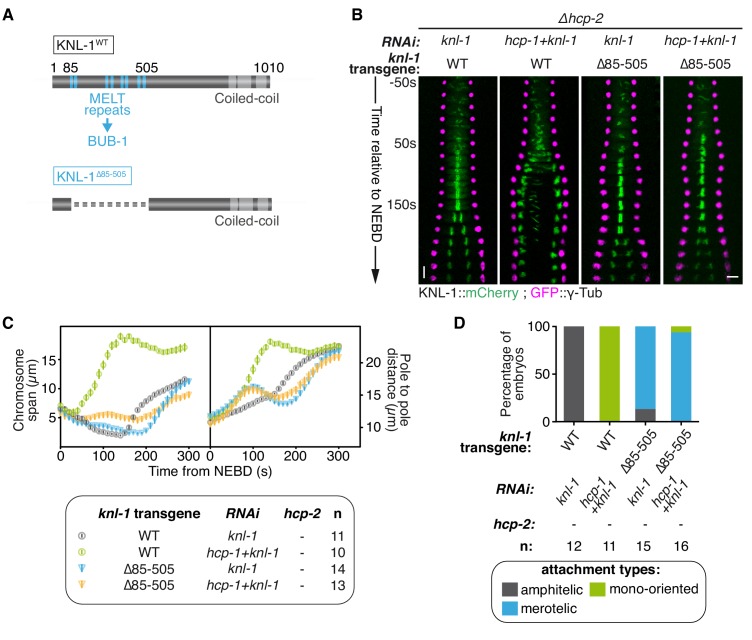
Figure 2—source data 1. Chromosome span and pole to pole distance as functions of time after NEBD for the indicated conditions.
DOI: 10.7554/eLife.40690.015
Figure 2—source data 2. Percentage of embryos with chromosomes engaged in amphitelic, merotelic and mono-oriented attachments, in the indicated conditions.
DOI: 10.7554/eLife.40690.016

Figure 2.

Figure 2—figure supplement 1. Biorientation inhibition requires BUB-1 localization at the kinetochore.

Figure 2—figure supplement 1.

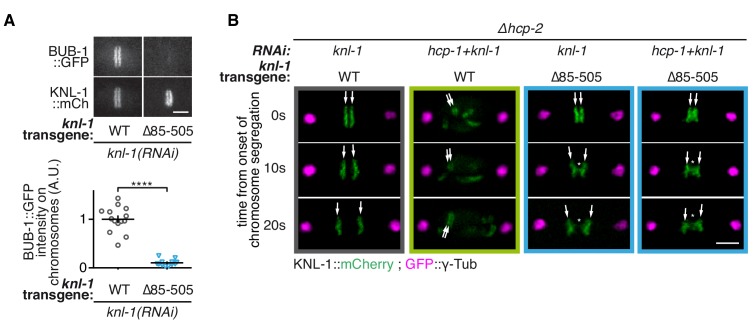
(A) Top: Representative images showing BUB-1::GFP recruitment to kinetochores (KNL-1::mCHerry) in presence of different KNL1 transgenes at metaphase. Bottom: Quantification of the BUB-1::GFP signal measured on kinetochores at metaphase in the indicated conditions. A Mann Whitney test was used to determine significance (p < 0.0001). (B) Representative images of kinetochores (KNL-1::mCherry, green) and spindle poles (GFP::γ-Tub, magenta), at different times from the onset of chromosome segregation for the indicated conditions. White arrows point towards sister kinetochores. White asterisks indicate the presence of kinetochore stretches. Scale bars, 5 μm.
Figure 2—figure supplement 1—source data 1. BUB-1::GFP signal measured on kinetochores at metaphase in the indicated conditions.
DOI: 10.7554/eLife.40690.014