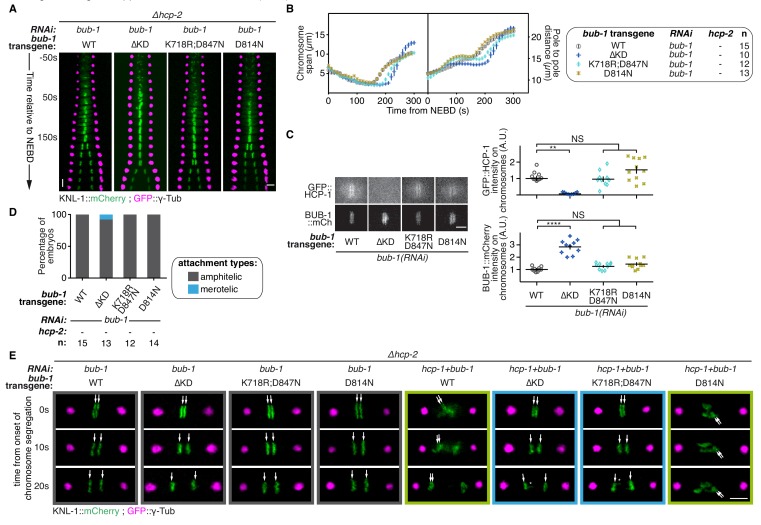
(A) Kymographs generated from embryos expressing GFP::γ-Tub and KNL-1::mCherry, for the different indicated conditions. (B) Chromosome span and pole to pole distance as functions of time after NEBD for the indicated conditions. (C) Representative images showing the kinetochore recruitment of GFP::HCP-1CENP-F and the different BUB-1::mCherry transgenes at metaphase. Quantification of the BUB-1::mCherry and GFP::HCP-1CENP-F signals measured on kinetochores at metaphase in the indicated conditions. Kruskall Wallis tests with Dunn’s correction for multiplicity were used to assess significance (GFP::HCP-1CENP-F ∆KD p = 0,0029, GFP::HCP-1CENP-F K718R;D847N p > 0,9999, GFP::HCP-1CENP-F D814N p = 0,4366, BUB-1::mCherry ∆KD p < 0,0001, BUB-1::mCherry K718R;D847N p = 0,5369, BUB-1::mCherry D814N p = 0,1915). (D) Quantification of the percentage of embryos with chromosomes engaged in amphitelic and merotelic attachments in the indicated conditions. (E) Representative images of kinetochores (KNL-1::mCherry, green) and spindle poles (GFP::γ-Tub, magenta), at different times from the onset of chromosome segregation for the indicated conditions. White arrows point towards sister kinetochores. White asterisks indicate the presence of kinetochore stretches. Error bars represent the SEM. Horizontal scale bars, 5 μm; Vertical scale bar, 20 s.
Figure 3—figure supplement 1—source data 1. Chromosome span and pole to pole distance as functions of time after NEBD for the indicated conditions.
Figure 3—figure supplement 1—source data 2. BUB-1::mCherry and GFP::HCP-1CENP-F signals measured on kinetochores at metaphase in the indicated conditions.
Figure 3—figure supplement 1—source data 3. Percentage of embryos with chromosomes engaged in amphitelic and merotelic, in the indicated conditions.


