. 2018 Dec 14;7:e40690. doi: 10.7554/eLife.40690

Figure 5. BUB-1 inhibits biorientation in absence of HCP-1/2CENP-F by preventing SKA complex recruitment.

(A) Schematics of the potential mechanism for chromosome biorientation inhibition by BUB-1 in absence of HCP-1/2CENP-F. BUB-1 limits attachment maturation by the SKA complex, leading to the incapacity for chromosomes to birorient when microtubules are short and non-dynamic. Co-depleting BUB-1 restores SKA complex recruitment, allowing the strengthening of attachments and therefore the establishment of biorientation even when microtubules are short and non-dynamic. (B) Left: Representative images from time-lapse movies showing the localization of SKA-1::GFP on chromosomes (H2B::mCherry) in the indicated conditions at metaphase. Right: Quantification of the GFP signal on chromosomes at metaphase. Kruskall Wallis tests with Dunn’s correction for multiplicity were used to assess significance (hcp-1(RNAi) p = 0,0006, hcp-1 +bub-1(RNAi) p > 0.9999, zyg-1(RNAi) p > 0,9999). (C) Kymographs generated from embryos expressing GFP::γ-Tub and KNL-1::mCherry for the indicated conditions. (D) Quantification of the percentage of embryos with chromosomes engaged in amphitelic, merotelic and mono-oriented attachments in the indicated conditions. (E) Chromosome span and pole to pole distance as functions of time after NEBD for the indicated conditions. Error bars represent the SEM. Horizontal scale bars, 5 μm; Vertical scale bar, 20 s.

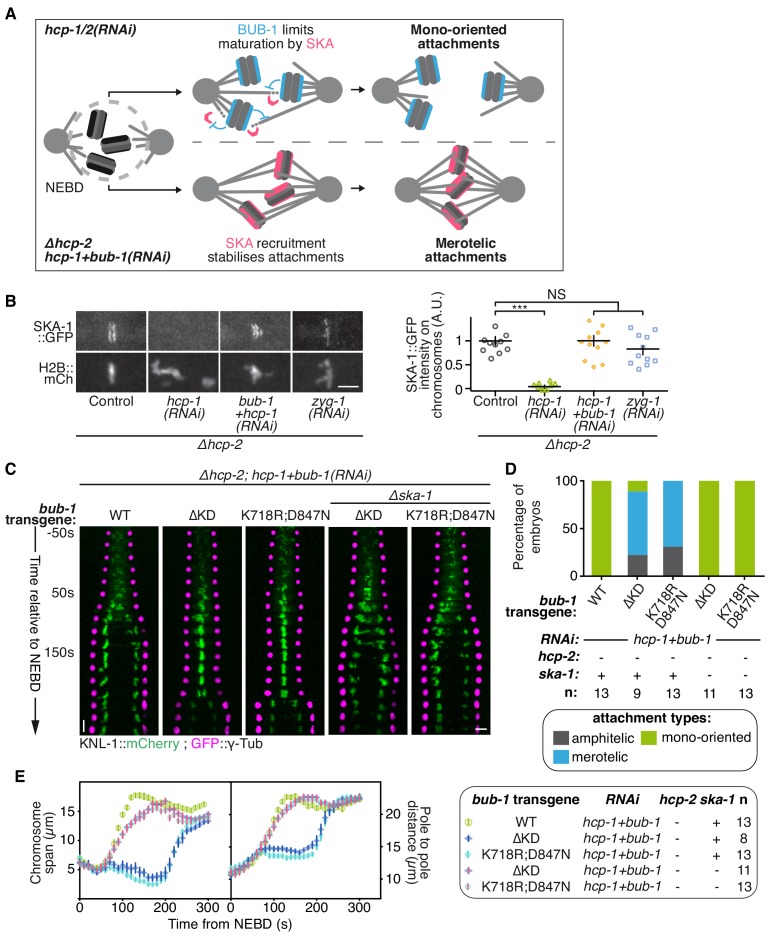
Figure 5—source data 1. SKA-1::GFP signal on chromosomes at metaphase.
DOI: 10.7554/eLife.40690.044
Figure 5—source data 2. Percentage of embryos with chromosomes engaged in amphitelic, merotelic and mono-oriented attachments, in the indicated conditions.
DOI: 10.7554/eLife.40690.045
Figure 5—source data 3. Chromosome span and pole to pole distance as functions of time after NEBD for the indicated conditions.
DOI: 10.7554/eLife.40690.046

Figure 5.

Figure 5—figure supplement 1. BUB-1 does not inhibit biorientation via AIR-2AuroraB.

Figure 5—figure supplement 1.

(A) Schematics of the potential mechanism for chromosome biorientation inhibition by BUB-1 in absence of HCP-1/2CENP-F. BUB-1 promotes attachment destabilisation by AIR-2AuroraB, leading to the incapacity for chromosomes to biorient when microtubules are short and non-dynamic. Co-depleting BUB-1 limits AIR-2AuroraB-dependent attachment destabilization, allowing the strengthening of attachments and therefore the establishment of chromosome biorientation even when microtubules are short and non-dynamic. (B) Kymographs generated from embryos expressing GFP::β-Tub and H2B::mCherry for the indicated conditions. (C) Chromosome span and pole to pole distance as functions of time after NEBD for the indicated conditions. Error bars represent the SEM. Horizontal scale bar, 5 μm; Vertical scale bar, 20 s.
Figure 5—figure supplement 1—source data 1. Chromosome span and pole to pole distance as functions of time after NEBD for the indicated conditions.
DOI: 10.7554/eLife.40690.037
Figure 5—figure supplement 2. BUB-1 inhibits chromosome biorientation in absence of HCP-1/2CENP-F by preventing SKA complex recruitment.

Figure 5—figure supplement 2.

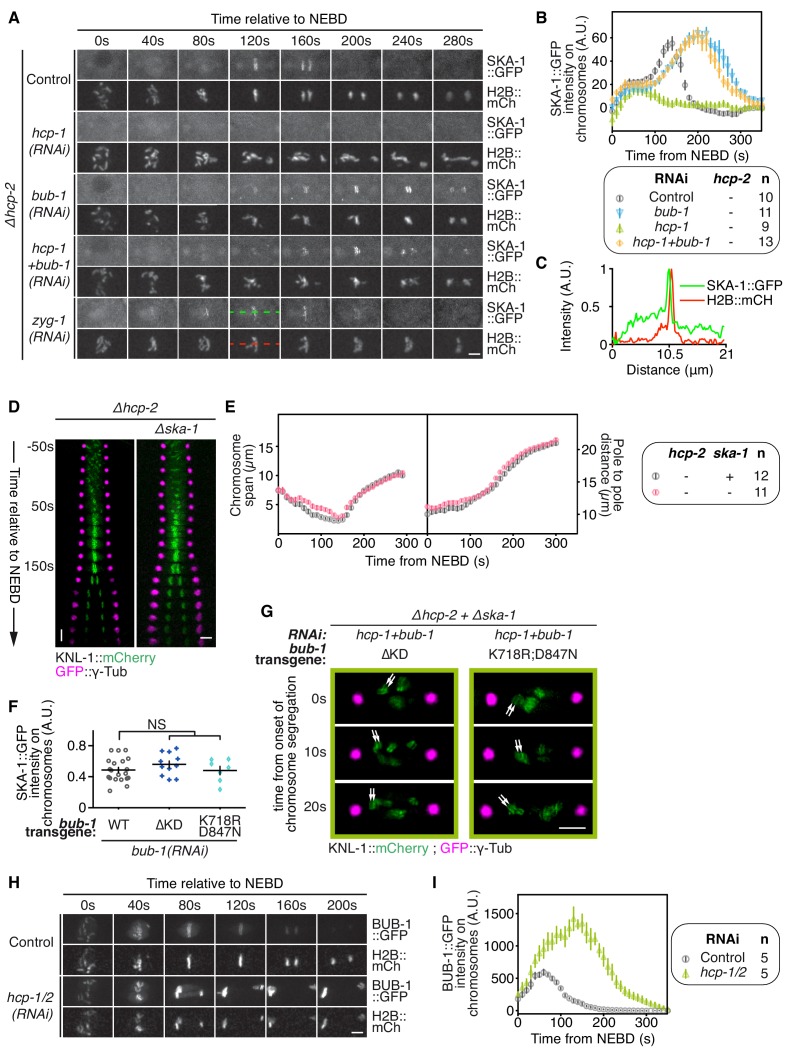
(A) Representative images from time-lapse movies showing localizations of SKA-1::GFP on chromosomes (H2B::mCherry) in the indicated conditions at different times relative to NEBD. (B) Quantification of the integrated SKA-1::GFP signal measured on chromosomes as a function of time from NEBD for the indicated conditions. (C) Quantification of the SKA-1::GFP and H2B::mCherry intensities along a linescan depicted by the dotted lines in (A) at 120 s after NEBD. (D) Kymographs generated from embryos expressing GFP::γ-Tub and KNL-1::mCherry for the indicated conditions. (E) Chromosome span and pole to pole distance as functions of time after NEBD for the indicated conditions. (F) Quantification of the SKA-1::GFP signal on chromosomes at metaphase in the indicated conditions. Kruskall Wallis tests with Dunn’s correction for multiplicity were used to assess significance (∆KD p = 0,5079, K718R;D847N p > 0,9999. (G) Representative images of kinetochores (KNL-1::mCherry, green) and spindle poles (GFP::γ-Tub, magenta) at different times from the onset of chromosome segregation for the indicated conditions. White arrows point towards sister kinetochores. (H) Representative images from time-lapse movies showing localizations of BUB-1::GFP on chromosomes (H2B::mCherry) in the indicated conditions at different times relative to NEBD. (I) Quantification of the integrated BUB-1::GFP signal measured on chromosomes as a function of time from NEBD for the indicated conditions. Error bars represent the SEM. Horizontal scale bars, 5 μm; Vertical scale bar, 20 s.
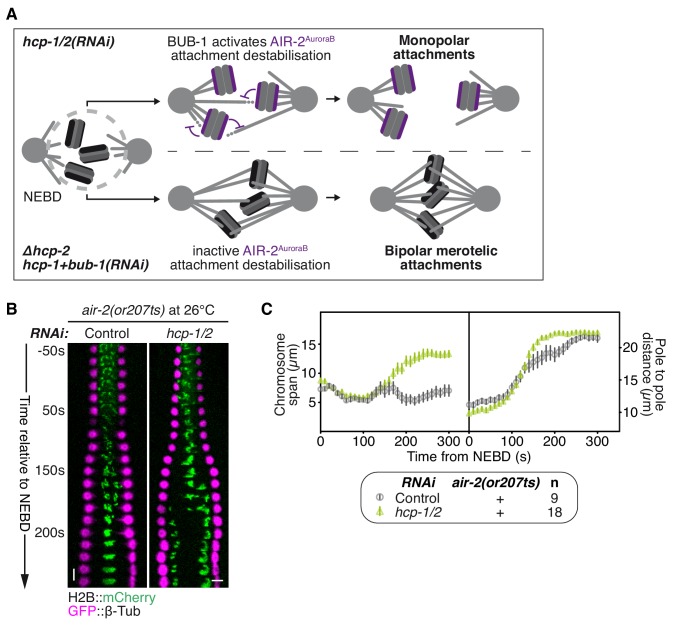
Figure 5—figure supplement 2—source data 1. SKA-1::GFP signal measured on chromosomes as a function of time.
DOI: 10.7554/eLife.40690.039
Figure 5—figure supplement 2—source data 2. SKA-1::GFP and H2B::mCherry intensities along a linescan.
DOI: 10.7554/eLife.40690.040
Figure 5—figure supplement 2—source data 3. Chromosome span and pole to pole distance as functions of time after NEBD for the indicated conditions.
DOI: 10.7554/eLife.40690.041
Figure 5—figure supplement 2—source data 4. SKA-1::GFP signal on chromosomes at metaphase in the indicated conditions.
DOI: 10.7554/eLife.40690.042
Figure 5—figure supplement 2—source data 5. Integrated BUB-1::GFP signal measured on chromosomes as a function of time.
DOI: 10.7554/eLife.40690.043