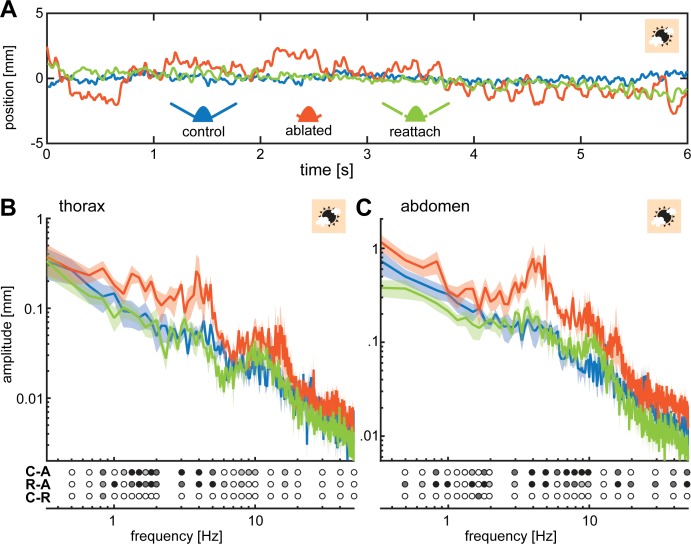
Figure 2. Flagella ablated hawkmoths showed greater thorax and abdomen movements during hovering flight at a stationary flower.
(A) When hawkmoths hovered in front of a stationary flower at 3000 lux, it was notable that flagella ablated moths jittered around their target position with larger amplitudes than moths of the other two antennal conditions, as quantified by the position of their thorax. The nectary is centered at 0 mm in this graph. (B) The thorax of moths with ablated flagella jittered with significantly higher amplitudes than the other two antennal conditions at frequencies between 1 and 5 Hz. There was no significant difference between control and re-attached moths. (C) The position of the abdomen in the three antennal treatments showed a similar trend to the thorax: the flagella ablated moths exhibited significantly larger abdomen jitter in the frequency range between 0.5 and 10 Hz than the other two treatments. (B, C) Lines show average, and shaded areas ± SEM. Statistical significance is indicated below the plots as: black p < 0.001, dark grey: p < 0.01, grey p < 0.05, white p > 0.05. Post-hoc tests were performed as part of a general linear model including antennal treatment and frequency (binned to the logarithmic scale) as factors, see Supplementary file 2 and Supplementary file 3.


