. 2018 Nov 26;7:e38579. doi: 10.7554/eLife.38579

Figure 3. Deletion Nkx2-1, Foxa1 and Foxa2 at initiation blocks gastric differentiation and induces expression of squamocolumnar junctional markers in lung neoplasia.

(A) tSNE plot of single-cell mRNA-Seq data derived from murine lung tumor cells (n = 134). Cells were sorted based on tdTomato expression from mice of the following genotypes: KrasLSL-G12D/+(K), n = 1 mouse), KrasLSL-G12D/+; Nkx2-1F/F (KN), n = 1 mouse), KrasLSL-G12D/+; Nkx2-1F/F; Foxa1F/F; Foxa2F/F (KNF1F2, n = 2 mice). Color indicates cancer cell cluster. Shape indicates genotype of mouse from which cell was isolated. (B) tSNE plot of three cancer cell clusters (C1–C3) and a panel of normal murine tissue. ‘Glandular’ indicates glandular stomach. (C) IHC for indicated proteins in lung neoplasia 5 weeks after initiation with PGK-Cre lentivirus in KrasLSL-G12D/+; Nkx2-1F/F; Foxa1F/F; Foxa2F/F mice and NKX2-1-negative controls. SCJ: normal squamocolumnar junction (forestomach on left, glandular stomach on right). Scale bar: 100 microns.

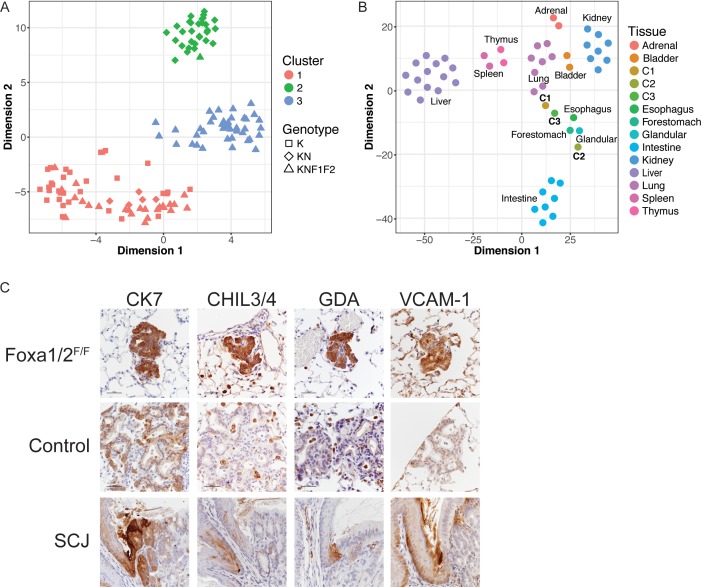
Figure 3.

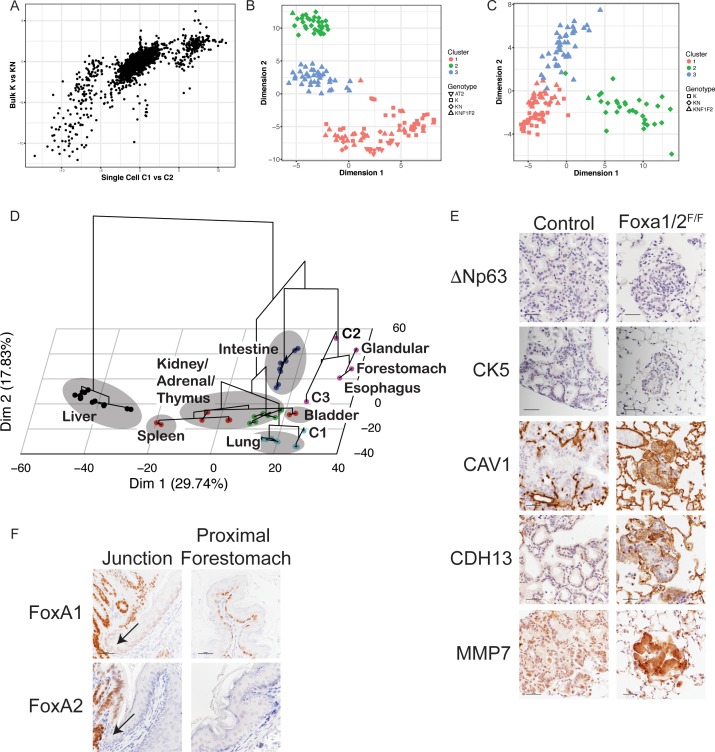
Figure 3—figure supplement 1. Deletion of Nkx2-1Foxa1 and Foxa2 at initiation blocks gastric differentiation and induces expression of squamocolumnar junctional markers in lung neoplasia.

Figure 3—figure supplement 1.

(A) Correlation between differentially expressed genes identified in single-cell analysis (C1 vs. C2, X axis) and population analysis (KrasLSL-G12D/+(K) vs. KrasLSL-G12D/+; Nkx2-1F/F (KN), Y axis). (B) tSNE plot of single high-quality tumor cells (this study) and E18.5 type two pneumocytes (AT2) from murine lung (Treutlein et al.). Color indicates cluster. Shape indicates source of cell. (C) Principal component analysis (PCA) of cancer cell clusters (C1–C3) based on genes comprising invasive mucinous adenocarcinoma signature (Guo et al). (D) Hierarchical clustering on principal components (HCPC) of the three cancer cell clusters (C1–C3) and normal murine tissue. The first two dimensions of a principal component analysis (PCA) is overlayed with the hierarchical clustering of the first five PCA dimensions. Dot color indicates cluster to which sample was assigned in K-means clustering. Gray ovals highlight multiple samples from the same tissue. ‘Glandular’ indicates glandular stomach. (E) IHC for indicated proteins in lung neoplasia 5 weeks after initiation with PGK-Cre lentivirus in KrasLSL-G12D/+; Nkx2-1F/F; Foxa1F/F; Foxa2F/F mice and controls. Scale bar: 100 microns. (F) IHC for FoxA1 and FoxA2 at the squamocolumnar junction (SCJ) of glandular stomach and forestomach (left panels) and in proximal forestomach (right panels). Arrows point to SCJ. Scale bars: 100 microns.