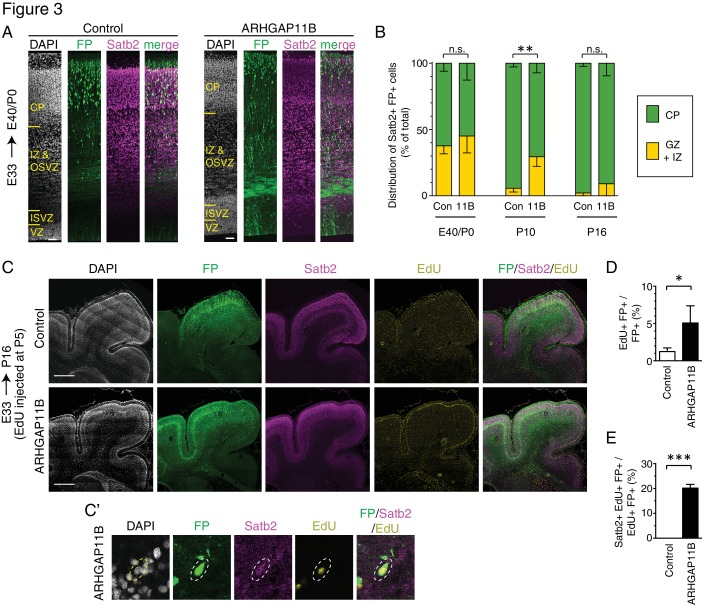
Figure 3. ARHGAP11B expression in developing ferret neocortex results in an extended neurogenic period.
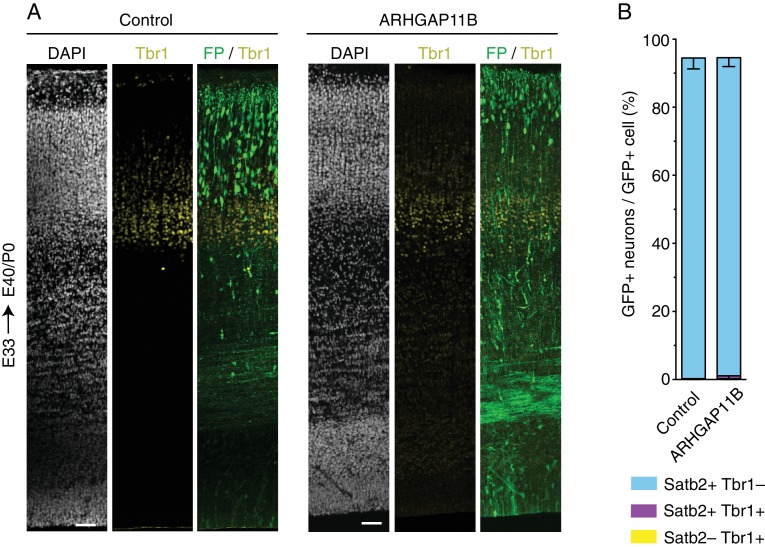
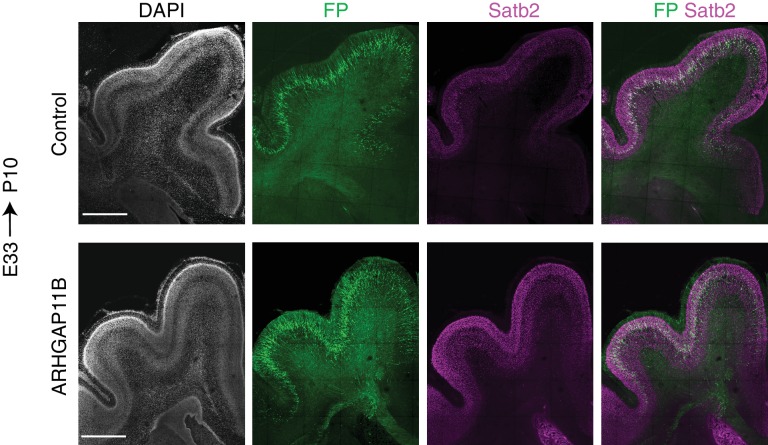
Ferret E33 neocortex was electroporated in utero with a plasmid encoding FP, together with either a plasmid encoding ARHGAP11B or empty vector (Control), followed by analysis at E40/P0 (A, B left), P10 (B center) and P16 (B right, (C–E). (A) Double immunofluorescence for FP (green) and Satb2 (magenta), combined with DAPI staining (white), of the E40/P0 ferret neocortex. The immunofluorescence of the same cryosection for Tbr1 is shown in Figure 3—figure supplement 1A. Images are single optical sections. Scale bars, 50 μm. (B) Distribution of Satb2+ FP+ neurons at E40/P0 (left), P10 (center) and P16 (right), between the cortical plate (CP, green) and germinal zones plus intermediate zone (GZ + IZ, yellow), upon control (Con, left) and ARHGAP11B (11B, right) electroporations. Data are the mean of 3 (P0 and P10) or 4 (P16) experiments. Error bars indicate SD; **, p <0.01; n.s., not statistically significant; two-way ANOVA with Bonferroni post-hoc tests (P10, Control CP vs. ARHGAP11B CP, p =0.0015). (C) Triple (immuno)fluorescence for FP (green), Satb2 (magenta) and EdU (yellow), combined with DAPI staining (white), of the P16 ferret neocortex, upon EdU injection at P5. Images are single optical sections. Scale bars, 1 mm. (C') Higher magnification of a FP+ Satb2+ EdU+ neuron upon electroporation of the plasmid encoding FP together with the plasmid encoding ARHGAP11B. Dashed lines, cell body. Images (single optical sections) are oriented with the apical side facing down and are 50 μm wide. (D) Percentage of FP+ cells that are EdU+ upon control (white) and ARHGAP11B (black) electroporations. (E) Percentage of EdU+ FP+ cells that are Satb2+ upon control (white) and ARHGAP11B (black) electroporations. (D, E) Data are the mean of 3 experiments. Error bars indicate SD; ***, p <0.001; *, p <0.05; Student's t-test.


