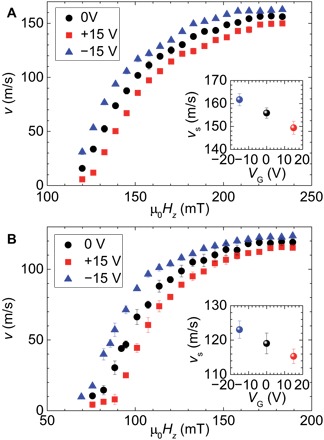
Fig. 2. Perpendicular magnetic field dependence of DW velocity.

v as a function of Hz obtained under the gate voltage VG of 0 V (circle), +15 V (square), and −15 V (triangle) for the samples with Co thickness tCo = (A) 0.78 nm and (B) 0.98 nm is shown. The error bar is the SD of five measurements for each μ0Hz. The insets show VG dependence of the saturation v (vs) in a high Hz regime. The error bar is the SD of vs.
