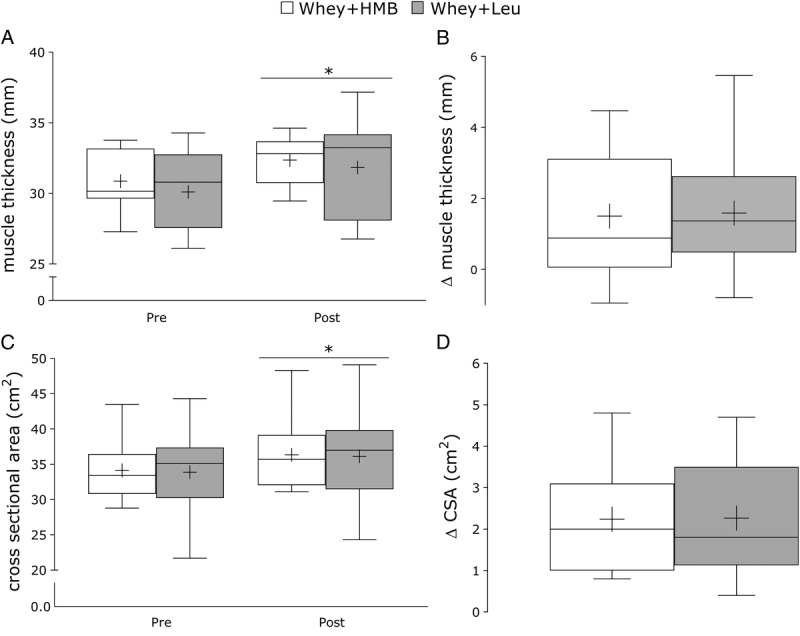
FIGURE 2.

A, Absolute values pretraining and posttraining and (B) change in vastus lateralis MT for whey+HMB (n = 13, open box) and whey+leu (n = 12, gray box) after 12 wk of undulating periodized RT. C, Absolute change and (D) Delta change in vastus lateralis cross-sectional area for whey+HMB and whey+leu. Values are presented as median (lines) with the interquartile range (boxes) ± minimum and maximum values (whiskers) and where + indicates the mean. *Significantly different (P < 0.05) from pretraining.
