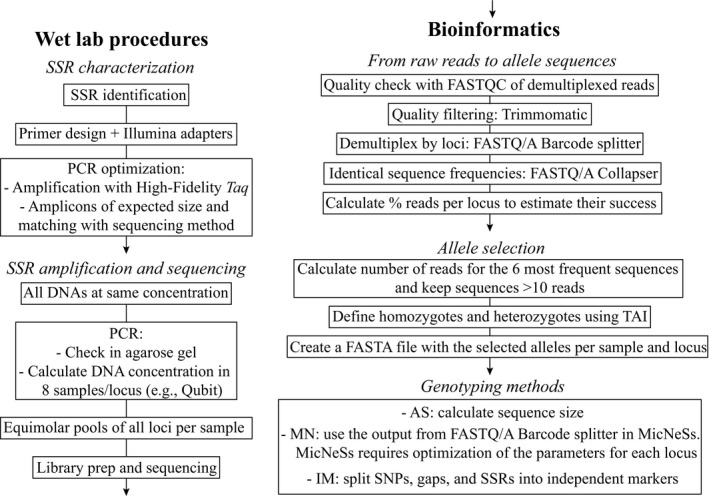
Figure 1.

Diagram chart of the pipeline followed in this study to genotype SSR regions using next‐generation sequencing. See Materials and Methods for details. AS = amplicon size scoring; MN = MicNeSs scoring; IM = independent marker scoring; TAI = true allele index.
