
Fig. 3.
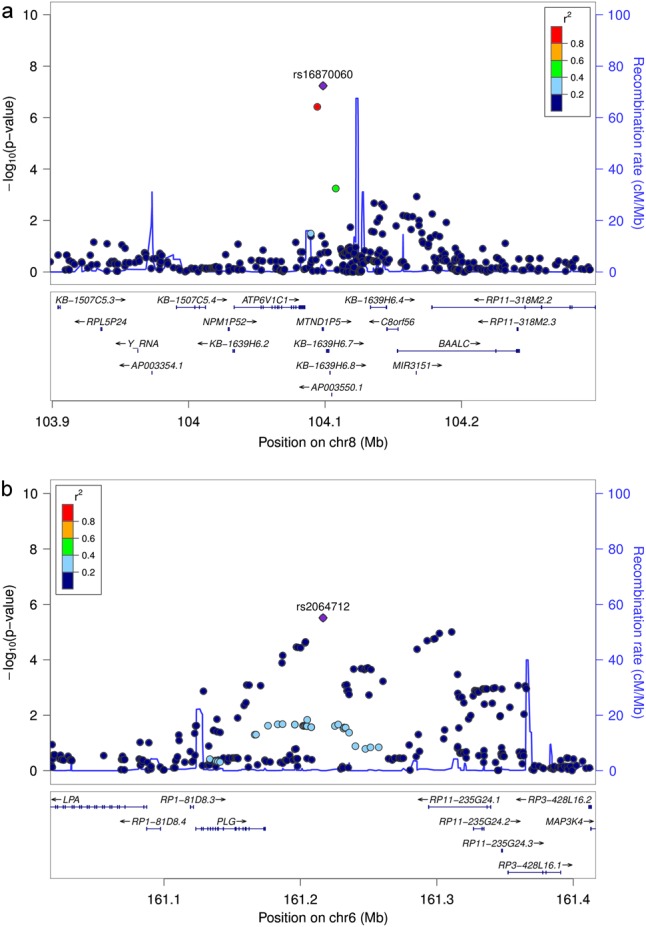
Regional association plots of the loci with P < 10−6 for the lead variants identified after removing the smallest sample of AgP-NL. Due to the low number of variants that were existent in all samples, this plot is based on the results of the meta-analysis in the first stage including AgP-GER, CP-EA-sev, and CP-EA-mod and excluding CP-Ger. a SNP rs16870060 at 8q22.3 and b SNP rs2064712 at 6q26