Fig. 1.
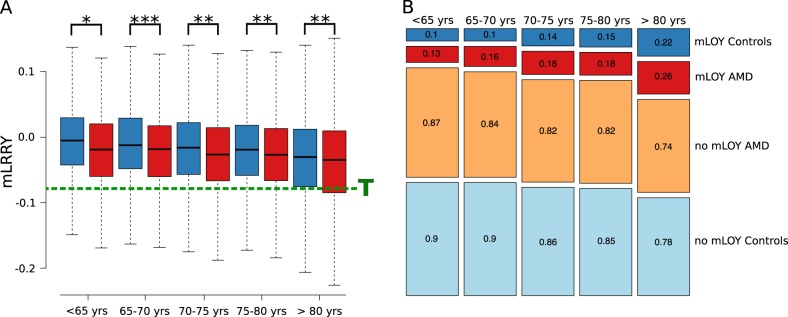
Boxplot and mosaicplot of mLOY in AMD patients and controls across different age groups. a The distribution of the mean LRR value across 608 SNP probes on the Y chromosome (mLRRY) for cases (red) and controls (blue) are depicted as a boxplot across different age strata. The threshold (T) for mLOY (mLRRY < −0.08) is depicted as a dashed green line. Significant differences between the mean mLRRY of cases and controls, as assessed by multivariate linear regression models adjusted for age, two principal components and AMD genetic risk score are depicted with asterisks: *P < 0.05; **P < 0.01; ***P < 0.001. b Patients with significant loss of Y chromosome (mLOY) were defined by a mLRRY smaller than one standard deviation from the mean mLRRY values of controls (mLRRY < −0.08). The occurrence of mLOY increased with age in controls (blue) as well as AMD patients (red). Conversely, cases (orange) as well as controls (light blue) with no mLOY were less frequently observed with increasing age. Absolute number of cases and the statistical assessment are given in Table 1

