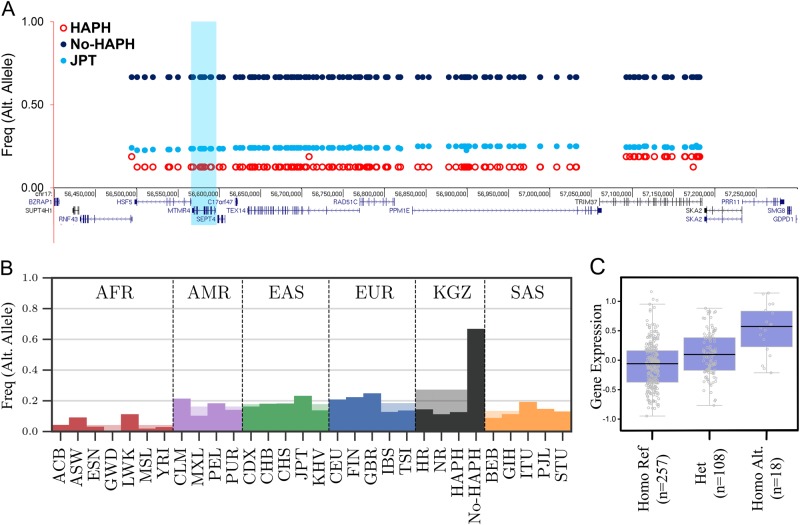
Fig. 3.
Layout of genetic variation in the top selected interval-1 in the HAPH, No-HAPH and JPT (outgroup) populations (a). The haplotype frequencies among No-HAPH is higher compared with HAPH and JPT. b Frequency of the top selected haplotype (interval-1) among Kyrgyz highlanders and populations from the 1000 Genome Project. The y axis is frequency of one of the SNPs (out of 147 fully linked SNPs) of the selected haplotype. c A representative box plot showing the genotype of an eQTL SNP in interval-1 and the respective expression of gene in Lung (P = 1.5e-11)

