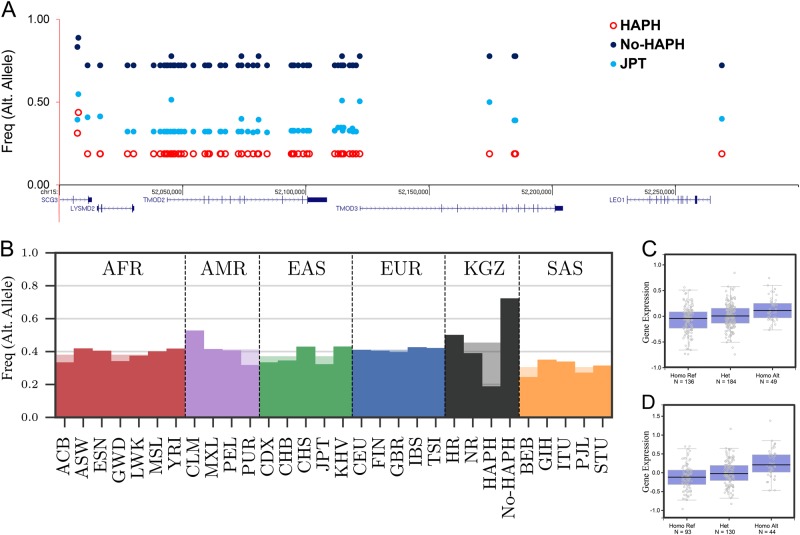
Fig. 4.
Layout of genetic variation in selected interval-2 in the HAPH, No-HAPH and JPT (outgroup) populations (a). Haplotype frequencies among No-HAPH are higher compared with HAPH and JPT. b Frequency of a SNP from a set of perfectly linked SNP of interval-2 among Kyrgyz highlanders and populations from the 1000 Genome Project (b). Box plot of SNPs, rs11637876 (c) and rs12913583 (d) from interval-2 that was identified as eQTL for the expression of TMOD3 (P = 5.5e–7 for both SNPs)

