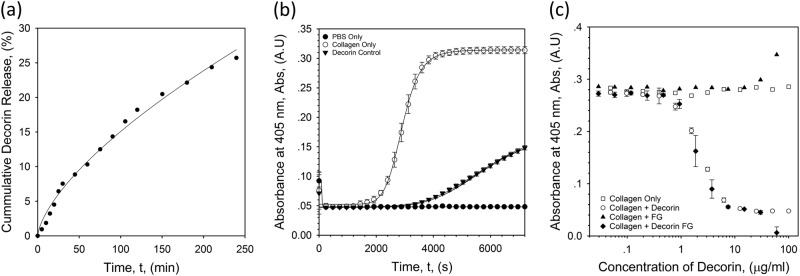
Fig. 2.
In vitro assays demonstrating the formulated eye drop’s bioactivity. a Cumulative release curve for hrDecorin loaded eye drops over 4 h (240 min). Line of best fit follows a power function, y=0.7x0.7 (R2 = 0.99). b Collagen fibrillogenesis turbidity data for PBS control, collagen only and collagen + hrDecorin. c Collagen fibrillogenesis turbidity data with a dose response curve for collagen, collagen + hrDecorin, collagen + fluid gel (FG) only, collagen + hrDecorin loaded fluid gel (DecFG)

