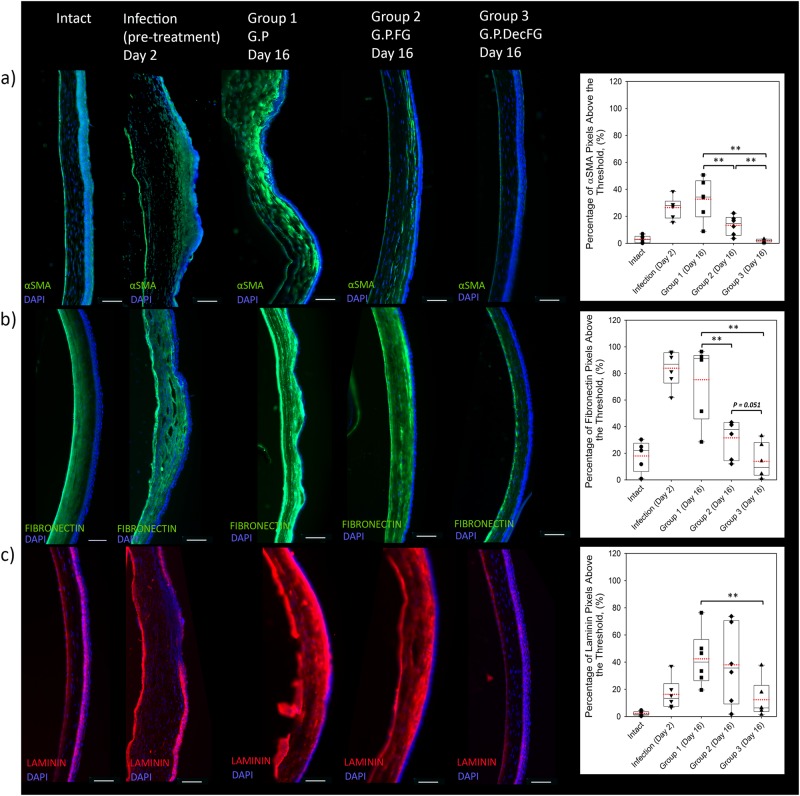
Fig. 5.
Extracellular matrix levels in the cornea. Representative images of immunohistochemical staining with accompanying plots quantifying the IR for: a αSMA+ (green to stain myofibroblasts), b IR fibronectin+ (green to stain fibronectin in the ECM), and c laminin+ (red to stain laminin in the ECM), in each case DAPI+ was used to stain the cell nuclei (blue). Analysis was undertaken on intact eyes, eyes taken at 2 days post infection and eyes obtained after 16 days with various eye drop treatments: (i) Gentamicin and Prednisolone (G.P), (ii) Gentamicin, Prednisolone, and fluid gel (G.P.FG), and (iii) Gentamicin, Prednisolone and hrDecorin fluid gel (G.P.DecFG). All studies were done using n = 6 treatment groups, with quantification performed on masked images unknown to the observer (scale bar = 100 µm)

