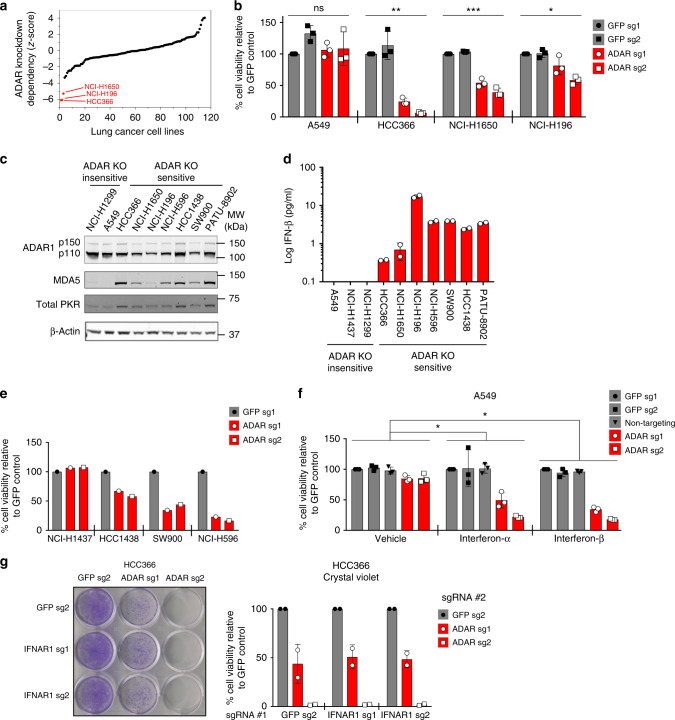
Fig. 1.
High expression of ISGs in cancer cell lines is predictive of sensitivity to ADAR deletion. aZ-scores representing the degree of cell lethality after ADAR knockdown in lung cancer cell lines included in published genome-scale loss-of-function screens9. Z-scores represent the number of standard deviations from the mean for each data point. b Cell viability was assessed by ATP bioluminescence 11 days after GFP or ADAR KO with CRISPR-Cas9. ATP bioluminescence values were normalized to the GFP sg1 control within each cell line. Three independent biological replicates were performed for each cell line. *p = 0.0054, **p = 0.0008, and ***p < 0.0001 as calculated by the Kruskal–Wallis test. c Immunoblots showing protein levels of ISGs and β-actin (loading control) in ADAR KO-sensitive and KO-insensitive cancer cell lines (n = 3). d Spontaneous IFN-β secretion by ADAR KO-sensitive and KO-insensitive cancer cell lines as measured by ELISA 24 h after replacement of culture media. Technical replicates from one representative experiment are shown (n = 2). e Cell viability was assessed by ATP bioluminescence 11 days after GFP or ADAR KO with CRISPR-Cas9 in additional lung cancer cell lines. ATP bioluminescence values were normalized to the GFP sg1 control within each cell line (n = 1). f Cell viability of control or ADAR1-deficient A549 cells was assessed by ATP bioluminescence 3 days after vehicle or IFN-I treatment (10 ng/mL). ATP bioluminescence values were normalized to the GFP sg1 control within each treatment group. Three independent biological replicates were performed. Two-way ANOVA showed a significant interaction between ADAR KO and IFN-I treatment (*p < 0.0001, degrees of freedom = 8, F-ratio = 10.51). Dunnett’s multiple comparisons post-test showed a significant difference between vehicle and IFN-I treatment groups and between control and ADAR KO groups (*p < 0.0001). g Cell viability of control or IFNAR1-deficient HCC366 cells was assessed by crystal violet staining 11–13 days after GFP or ADAR KO with CRISPR-Cas9. A representative image of crystal violet staining (left) and quantitation of cell viability (right) from two independent biological replicates are shown. Cell viability values were normalized to the GFP sg2 control #2 within each group of isogenic cells. Error bars represent standard deviation in all graphs

