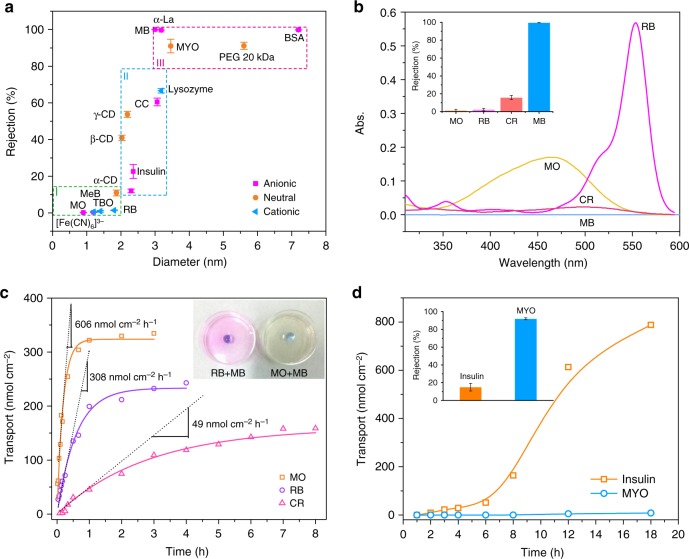
Fig. 3.
The separation performance of the cross-linked PTL membranes. a Separation performance of the 50-nm-thick PTL membranes for neutral and ionic compounds including region I, <10% rejection of molecules with diameters <2.0 nm; region II, 20–80% rejection of molecules with diameters of 2–3 nm; and region III, >90% rejection of molecules larger than 3 nm in diameter. b UV-vis spectra of the water side below the membrane after 12 h of permeation by using different dyes as the feed solution and the corresponding rejection ratios (inset). c Time-dependent transport of dyes through the PTL membrane and the transport rate calculated as the initial slope of the transport curve7,38. Optical photographs to show how the membrane rejects large molecules (methyl blue, MB) while allowing small molecules (methyl orange, MO and rhodamine B, RB) to pass through. d Time-dependent transport of proteins through the PTL membrane and the rejection ratios of MYO and insulin from the mixture (inset). The initial concentration of the protein solution is 10 mg mL−1. Data shown are the average of triplicates with standard deviation

