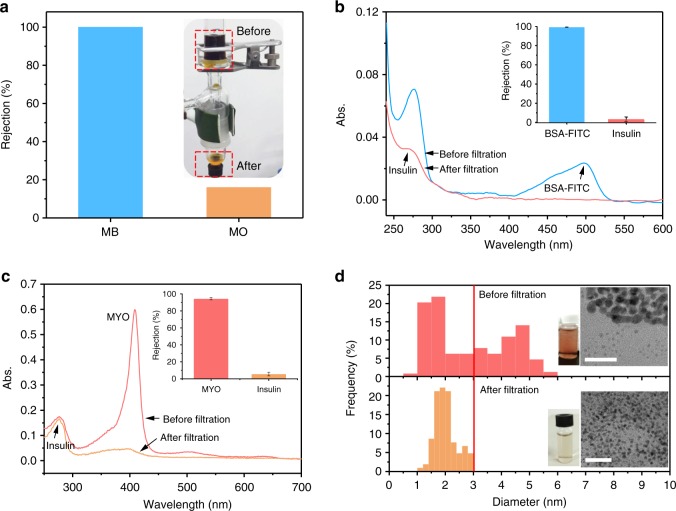
Fig. 5.
Pressure-driven filtration through the PTL membrane. a Rejection ratios of MB and MO from a dye mixture and the corresponding setup (inset). b UV/Vis spectra and rejection ratios (inset) of a protein mixture (BSA-FITC and insulin) before and after the filtration. c UV/Vis spectra and rejections ratios (inset) of a protein mixture (MYO and insulin) before and after the filtration. d TEM images and corresponding diameter distributions of gold nanoparticles in the feed solution before (1.0–6.0 nm) and after the filtration (1.0–3.1 nm). Scale bars are 20 nm. Data shown are the average of triplicates with standard deviation

