Fig. 3.
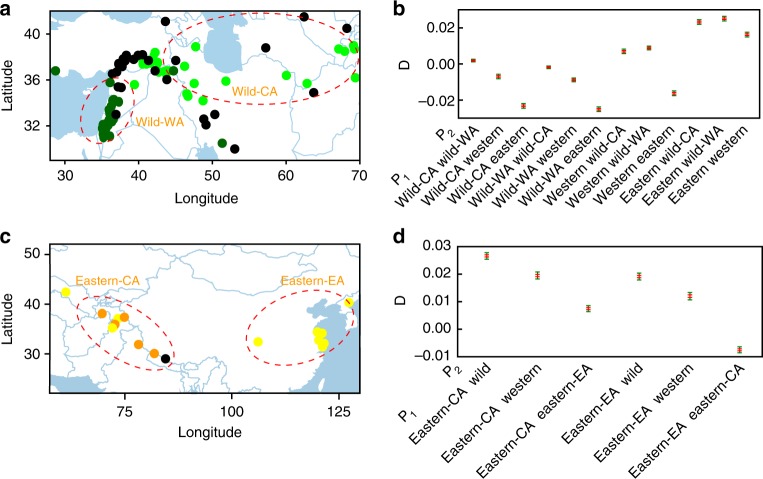
Genetic relationship between qingke and other barleys. a, c Distributions of the subpopulations of wild barley (a) and eastern barley (c), respectively, revealed by sNMF and PCA. wild-CA wild barley subpopulation distributed in central Asia, wild-WA wild barley subpopulation distributed in western Asia, eastern-CA eastern barley subpopulation distributed in central and southern Asia, eastern-EA eastern barley subpopulation distributed in eastern Asia. (b, d) D statistics for different quadruples of barley populations (P1–P3 and outgroup). Positive D values indicate that P1 shares more derived alleles with P3 than P2 does. Red bars correspond to ±1 standard errors, and green bars correspond to ±3 standard errors. P3 was fixed by qingke, and P4 was fixed by H. pubiflorum. b D statistics for different comparisons among wild-WA, wild-CA, western, and eastern barley. d D statistics for different comparisons among wild barley, western barley, eastern-CA, and eastern-EA. a, c were generated in R (V3.4.3) using packages maps, maptools, plyr, ggrepel, and ggplot2. Geographic information data were obtained from Global Administrative Areas database (GADM V2.8, November 2015). Source data are provided as a Source Data file

