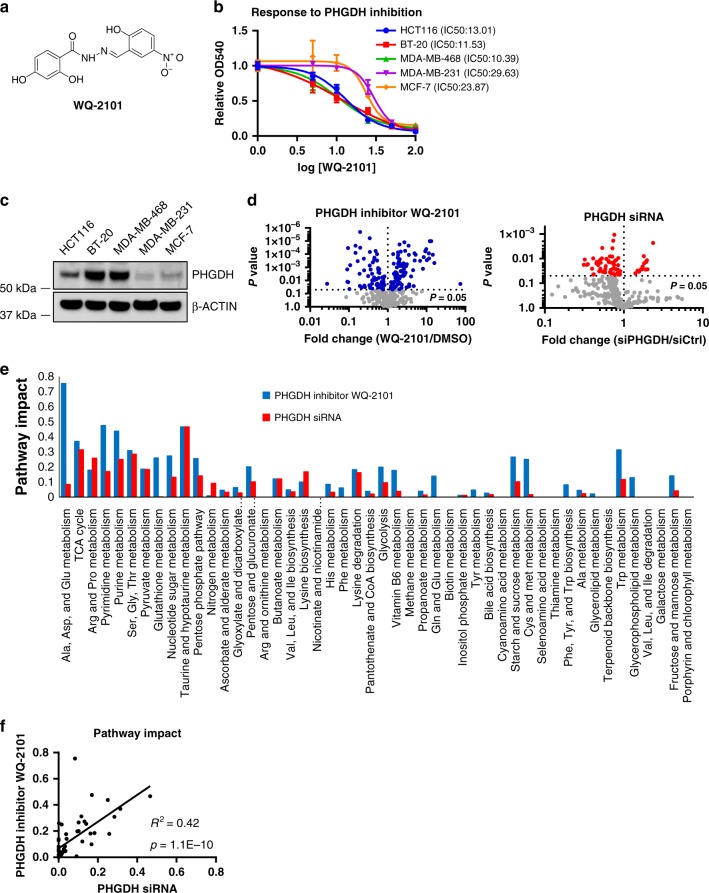
Fig. 1.
Inhibition of PHGDH induces broad changes in metabolism. a Chemical structure of PHGDH inhibitor WQ-2101. b Dose-dependent response of cell lines treated with PHGDH inhibitor WQ-2101 for 72 h. Data are the mean of three biological replicates, and error bars represent s.e.m. c Immunoblot demonstrating the expression level of PHGDH in cell lines. d Volcano plots of metabolites in response to cells treated with 25 μM PHGDH inhibitor WQ-2101 for 24 h (left), or 20 nM siRNA targeting PHGDH 72 h post-transfection (right). Colored dots represent metabolites significantly changed between control and treated conditions (P < 0.05). Data are mean of three biological replicates. e Network-based pathway analysis of statistically significant metabolites altered in each condition. f Scatter plot for correlation of metabolic pathway impact scores between WQ-2101 and siRNA targeting PHGDH

